アップデート済
Hurst Kalman Volume SuperTrend AI
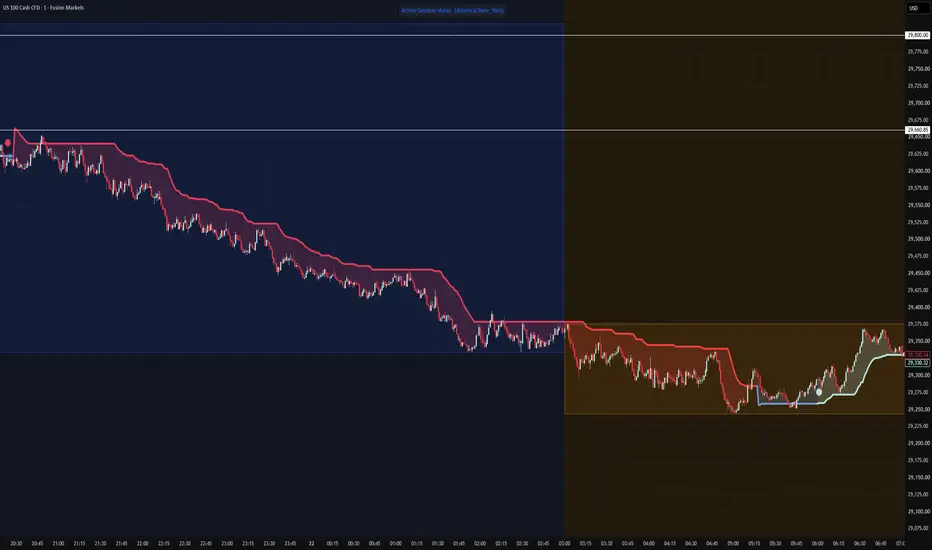
This indicator is a combination of multiple components combined into one SuperTrend indicator with artificial Intelligence.
Components include:
* Hurst Exponent
* Kalman Smoother
* Average True Range
* Volume Weighted Moving Average
* KNN Machine Learning (AI Component)
This indicator is designed to provide AI-generated signals while withstanding choppy markets and fake breakouts during consolidation, minimizing false signals and whipsaws (but not totally eliminate).
HOW TO USE:
* When you see a Green Triangle/Dot = BUY
* When you see a Red Triangle/Dot = SELL
It is best to use this indicator with a strategic framework and GREAT Risk management.
I do not claim to be the original maker of the components of this indicator. I just combined multiple components into one.
Credits go to these masters: Zeiierman, QuantAlgo
Components include:
* Hurst Exponent
* Kalman Smoother
* Average True Range
* Volume Weighted Moving Average
* KNN Machine Learning (AI Component)
This indicator is designed to provide AI-generated signals while withstanding choppy markets and fake breakouts during consolidation, minimizing false signals and whipsaws (but not totally eliminate).
HOW TO USE:
* When you see a Green Triangle/Dot = BUY
* When you see a Red Triangle/Dot = SELL
It is best to use this indicator with a strategic framework and GREAT Risk management.
I do not claim to be the original maker of the components of this indicator. I just combined multiple components into one.
Credits go to these masters: Zeiierman, QuantAlgo
リリースノート
This indicator is a combination of multiple components combined into one SuperTrend indicator with artificial Intelligence.Components include:
* Hurst Exponent
* Kalman Smoother
* Average True Range
* Volume Weighted Moving Average
* KNN Machine Learning (AI Component)
This indicator is designed to provide AI-generated signals while withstanding choppy markets and fake breakouts during consolidation, minimizing false signals and whipsaws (but not totally eliminate).
HOW TO USE:
* When you see a Green Triangle/Dot = BUY
* When you see a Red Triangle/Dot = SELL
It is best to use this indicator with a strategic framework and GREAT Risk management.
I do not claim to be the original maker of the components of this indicator. I just combined multiple components into one.
Credits go to these masters: Zeiierman, LuxAlgo, QuantAlgo
リリースノート
I updated the script so it will be less confusing. How to use the indicator:
When you see a Green Signal = BUY
When you see a Red Signal = SELL
When the SuperTrend goes into NEUTRAL territory (Blue line) ...
DO NOT CUT OR END THE TRADE IMMEDIATELY! Probably leave a runner and hold... (or take partials)... the indicator is designed to withstand whipsaws and consolidation and the trade may still continue the previous trend (as shown in the picture above). The tend will actually end when the indicator places an opposing signal.
Regardless, BETTER TO HAVE A MASTERFUL RISK MANAGEMENT when using this indicator.
By the way this is my last update on this script, if you want to follow my trades please check me out at:
Trade with me or copy my trades!
social.tp-redirect.com/s/6loYPBBR
Good luck to all of you!
リリースノート
Removed redundant signals. It should only trigger one signal per trend.リリースノート
Removed redundant entry signals.リリースノート
Removed redundant entry signals.リリースノート
Removed redundant entry signals.リリースノート
Removed redundant entry signals.リリースノート
Edited some lines out. Facebook Page: facebook.com/mftradealpha/
YouTube Page: youtube.com/@MFTradeAlpha -
Copy Trade Account: app.fusionmarkets.com/copy/strategy/123638
リリースノート
Edited some lines out.Facebook Page: facebook.com/mftradealpha/
YouTube Page: youtube.com/@MFTradeAlpha -
Copy Trade Account: app.fusionmarkets.com/copy/strategy/123638

免責事項
これらの情報および投稿は、TradingViewが提供または承認する金融、投資、取引、またはその他の種類の助言もしくは推奨であることを意図したものではなく、またこれらに該当するものでもありません。詳細は利用規約をご覧ください。
免責事項
これらの情報および投稿は、TradingViewが提供または承認する金融、投資、取引、またはその他の種類の助言もしくは推奨であることを意図したものではなく、またこれらに該当するものでもありません。詳細は利用規約をご覧ください。