OPEN-SOURCE SCRIPT
Cost Basis Map [FEELS]
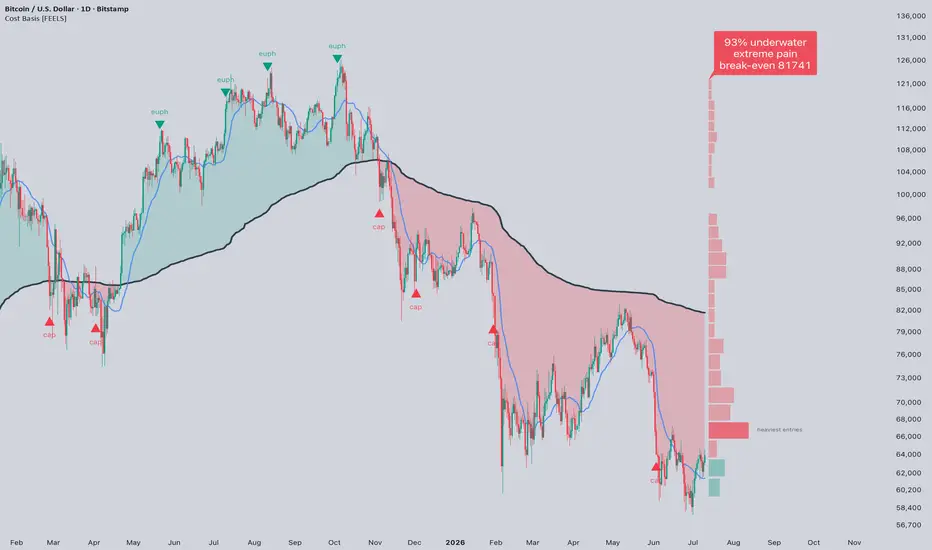
Who is in profit at this level, and who is trapped? Cost Basis Map estimates the answer for any symbol and any timeframe from nothing but price and volume. On-chain analytics answers the same question for Bitcoin with realized price and supply in profit, but those metrics need blockchain data, so they stop at BTC. This script rebuilds that framework from OHLCV for everything else.
The headline number is the share of open positions that is underwater right now. Everything else on the chart is built from the same ledger.
HOW THE LEDGER WORKS
The script maintains a ledger of open positions. Every bar adds its traded volume to the ledger at that bar's price, and the same volume closes a proportional share of the older positions. Old entries rotate out at a pace set by turnover rather than time: a few high-volume bars can replace a big part of the book, a quiet stretch barely touches it. The result is a bar-by-bar estimate of which positions are still open and what they paid. From it the script derives:
- Break-even line: the volume-weighted average entry of all open positions. This is the market's collective cost basis, the same construction on-chain research calls realized price.
- Underwater share: the % of open positions whose entry sits above the current price. It drives the headline, the fill color and the sentiment states (euphoria, healthy uptrend, mixed, majority trapped, extreme pain).
- Open-positions profile: the right-side histogram shows where the open positions were entered. Red rows above price are trapped positions waiting overhead, which tends to act as resistance and as squeeze fuel once price runs through it. Teal rows below are holders in profit, where support usually forms. The widest row is tagged as the heaviest entries.
- Capitulation marker: printed when an unusually large amount of volume (a z-score test) realizes losses below break-even. On everything I tested these cluster near major bottoms.
- Euphoria marker: printed when nearly every position is in profit and turnover is elevated, a condition typical of late trend.
- Recent entries line: the average entry of the newest cohort, the positions most likely to panic or chase first.
Positions are money-weighted by default (volume × price), with an option to weight by raw volume units instead.

HOW TO TRADE IT
1. Regime first. Price holding above a rising break-even line with a low underwater share is a healthy trend, and pullbacks into the line are buyable by ordinary trend rules. When price loses the break-even line the regime flips: the average holder is now at a loss, and rallies back into the line run into their exit orders.
2. Read the profile as a map of who needs what. Heavy red rows above price mark where trapped holders wait to break even, so expect supply there. Heavy teal rows below mark profitable entries that tend to get defended.
3. Extremes are mean-reversion territory. A capitulation marker on top of an extreme underwater share has marked the areas where selling exhausts. A euphoria marker with a single-digit underwater share is the same warning on the upside.
HONESTY
This is an estimation model built from price and volume. Real per-account position data does not exist anywhere on any platform; on-chain analytics estimates it too, just from a different source. The model's assumptions are simple and disclosed: entries at the bar's typical price, proportional volume-driven rotation of old positions. A fixed marker cooldown keeps signal episodes readable. Markers print on bar close and do not repaint. The tool is most informative on volatile assets and intraday-to-daily timeframes; on slow index weeklies the market spends years in profit and the picture is honestly boring. Volume quality matters: prefer a real exchange feed (e.g. Bitstamp, Coinbase, a specific futures contract) over composite indices, because aggregated feeds smooth out the volume spikes the engine reads. On symbols with no volume data the script falls back to equal weighting.

ALERTS
Cost basis reclaimed · Cost basis lost · Majority underwater (60%+) · Nearly all in profit · Capitulation volume · Euphoria turnover.
SETTINGS
Every input has a tooltip. The main ones: "Position memory" sets how long the ledger remembers (volume-weighted), "Ledger resolution" sets the price granularity, profile size/spacing and all colors are adjustable, "Text size" scales the captions for presentations.

ORIGINALITY
A volume profile shows where volume traded. This ledger goes one step further and estimates which of those positions are still open and what they paid, i.e. cost-basis analytics of the kind used in on-chain research, reconstructed from OHLCV for any market. The break-even line is not an MA or a VWAP band in disguise: it is computed from the position ledger, not from a lookback window. Engine and rendering are written from scratch.
The headline number is the share of open positions that is underwater right now. Everything else on the chart is built from the same ledger.
HOW THE LEDGER WORKS
The script maintains a ledger of open positions. Every bar adds its traded volume to the ledger at that bar's price, and the same volume closes a proportional share of the older positions. Old entries rotate out at a pace set by turnover rather than time: a few high-volume bars can replace a big part of the book, a quiet stretch barely touches it. The result is a bar-by-bar estimate of which positions are still open and what they paid. From it the script derives:
- Break-even line: the volume-weighted average entry of all open positions. This is the market's collective cost basis, the same construction on-chain research calls realized price.
- Underwater share: the % of open positions whose entry sits above the current price. It drives the headline, the fill color and the sentiment states (euphoria, healthy uptrend, mixed, majority trapped, extreme pain).
- Open-positions profile: the right-side histogram shows where the open positions were entered. Red rows above price are trapped positions waiting overhead, which tends to act as resistance and as squeeze fuel once price runs through it. Teal rows below are holders in profit, where support usually forms. The widest row is tagged as the heaviest entries.
- Capitulation marker: printed when an unusually large amount of volume (a z-score test) realizes losses below break-even. On everything I tested these cluster near major bottoms.
- Euphoria marker: printed when nearly every position is in profit and turnover is elevated, a condition typical of late trend.
- Recent entries line: the average entry of the newest cohort, the positions most likely to panic or chase first.
Positions are money-weighted by default (volume × price), with an option to weight by raw volume units instead.
HOW TO TRADE IT
1. Regime first. Price holding above a rising break-even line with a low underwater share is a healthy trend, and pullbacks into the line are buyable by ordinary trend rules. When price loses the break-even line the regime flips: the average holder is now at a loss, and rallies back into the line run into their exit orders.
2. Read the profile as a map of who needs what. Heavy red rows above price mark where trapped holders wait to break even, so expect supply there. Heavy teal rows below mark profitable entries that tend to get defended.
3. Extremes are mean-reversion territory. A capitulation marker on top of an extreme underwater share has marked the areas where selling exhausts. A euphoria marker with a single-digit underwater share is the same warning on the upside.
HONESTY
This is an estimation model built from price and volume. Real per-account position data does not exist anywhere on any platform; on-chain analytics estimates it too, just from a different source. The model's assumptions are simple and disclosed: entries at the bar's typical price, proportional volume-driven rotation of old positions. A fixed marker cooldown keeps signal episodes readable. Markers print on bar close and do not repaint. The tool is most informative on volatile assets and intraday-to-daily timeframes; on slow index weeklies the market spends years in profit and the picture is honestly boring. Volume quality matters: prefer a real exchange feed (e.g. Bitstamp, Coinbase, a specific futures contract) over composite indices, because aggregated feeds smooth out the volume spikes the engine reads. On symbols with no volume data the script falls back to equal weighting.
ALERTS
Cost basis reclaimed · Cost basis lost · Majority underwater (60%+) · Nearly all in profit · Capitulation volume · Euphoria turnover.
SETTINGS
Every input has a tooltip. The main ones: "Position memory" sets how long the ledger remembers (volume-weighted), "Ledger resolution" sets the price granularity, profile size/spacing and all colors are adjustable, "Text size" scales the captions for presentations.
ORIGINALITY
A volume profile shows where volume traded. This ledger goes one step further and estimates which of those positions are still open and what they paid, i.e. cost-basis analytics of the kind used in on-chain research, reconstructed from OHLCV for any market. The break-even line is not an MA or a VWAP band in disguise: it is computed from the position ledger, not from a lookback window. Engine and rendering are written from scratch.
オープンソーススクリプト
TradingViewの精神に則り、このスクリプトの作者はコードをオープンソースとして公開してくれました。トレーダーが内容を確認・検証できるようにという配慮です。作者に拍手を送りましょう!無料で利用できますが、コードの再公開はハウスルールに従う必要があります。

💰Free Channel — t.me/FeelsStrategy
🤵For more info contact — t.me/VolodymyrFeels
🔗 Links — feelsstrategy.com/links
🤵For more info contact — t.me/VolodymyrFeels
🔗 Links — feelsstrategy.com/links
免責事項
これらの情報および投稿は、TradingViewが提供または承認する金融、投資、取引、またはその他の種類の助言もしくは推奨であることを意図したものではなく、またこれらに該当するものでもありません。詳細は利用規約をご覧ください。
オープンソーススクリプト
TradingViewの精神に則り、このスクリプトの作者はコードをオープンソースとして公開してくれました。トレーダーが内容を確認・検証できるようにという配慮です。作者に拍手を送りましょう!無料で利用できますが、コードの再公開はハウスルールに従う必要があります。
💰Free Channel — t.me/FeelsStrategy
🤵For more info contact — t.me/VolodymyrFeels
🔗 Links — feelsstrategy.com/links
🤵For more info contact — t.me/VolodymyrFeels
🔗 Links — feelsstrategy.com/links
免責事項
これらの情報および投稿は、TradingViewが提供または承認する金融、投資、取引、またはその他の種類の助言もしくは推奨であることを意図したものではなく、またこれらに該当するものでもありません。詳細は利用規約をご覧ください。