OPEN-SOURCE SCRIPT
Mag7 + SPY Multi-Decade Seasonality
📊 Overview
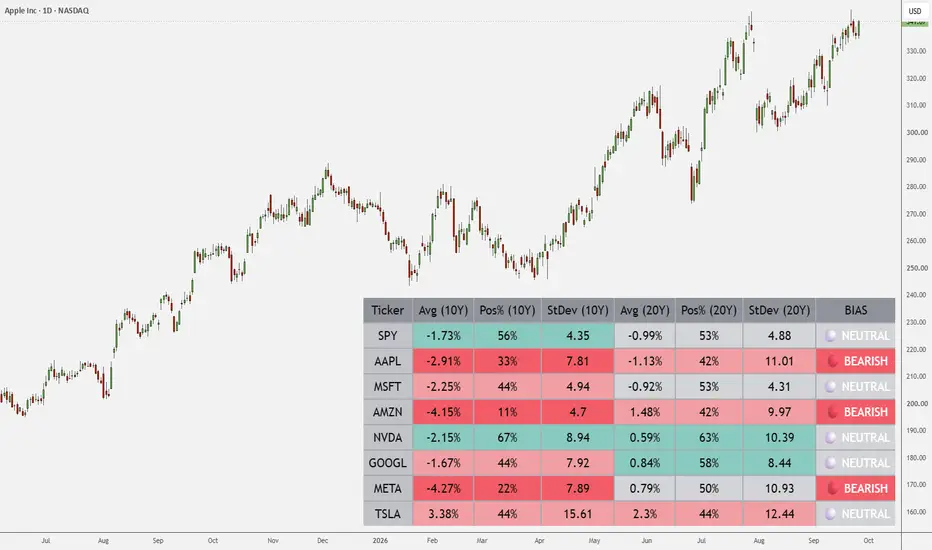
The Mag7 + SPY Seasonal Dashboard tracks historical monthly seasonality across the Magnificent 7 (AAPL, MSFT, AMZN, NVDA, GOOGL, META, TSLA) and the SPY benchmark.
It dynamically pulls monthly timeframe data (1M) for the current calendar month and calculates multi-period historical metrics over 10-Year and 20-Year lookback windows.
⚙️ Key Tracked Metrics:
- Avg Return (Avg): Average historical percentage return for the current calendar month.
- Win Rate (Pos%): Percentage of historical years where the current month closed positive.
- Volatility (StDev): Standard deviation of historical monthly returns for dispersion analysis.
- Institutional BIAS:
🟢 BULLISH: Pos% (10Y) $\ge$ 70% AND Pos% (20Y) $\ge$ 60%.
🔴 BEARISH: Pos% (10Y) $\le$ 40% OR Pos% (20Y) $\le$ 40%.
⚪ NEUTRAL: Mixed or balanced historical performance.
🎯 How to Use:
- Apply the indicator overlay to any chart (the dashboard uses fixed 1M security requests, so chart timeframe won't alter the table).
- Scan the BIAS column for strong cross-period alignment between the 10-year and 20-year windows.
- Combine directional seasonal bias with technical market structure and intraday execution triggers.
The Mag7 + SPY Seasonal Dashboard tracks historical monthly seasonality across the Magnificent 7 (AAPL, MSFT, AMZN, NVDA, GOOGL, META, TSLA) and the SPY benchmark.
It dynamically pulls monthly timeframe data (1M) for the current calendar month and calculates multi-period historical metrics over 10-Year and 20-Year lookback windows.
⚙️ Key Tracked Metrics:
- Avg Return (Avg): Average historical percentage return for the current calendar month.
- Win Rate (Pos%): Percentage of historical years where the current month closed positive.
- Volatility (StDev): Standard deviation of historical monthly returns for dispersion analysis.
- Institutional BIAS:
🟢 BULLISH: Pos% (10Y) $\ge$ 70% AND Pos% (20Y) $\ge$ 60%.
🔴 BEARISH: Pos% (10Y) $\le$ 40% OR Pos% (20Y) $\le$ 40%.
⚪ NEUTRAL: Mixed or balanced historical performance.
🎯 How to Use:
- Apply the indicator overlay to any chart (the dashboard uses fixed 1M security requests, so chart timeframe won't alter the table).
- Scan the BIAS column for strong cross-period alignment between the 10-year and 20-year windows.
- Combine directional seasonal bias with technical market structure and intraday execution triggers.
オープンソーススクリプト
TradingViewの精神に則り、このスクリプトの作者はコードをオープンソースとして公開してくれました。トレーダーが内容を確認・検証できるようにという配慮です。作者に拍手を送りましょう!無料で利用できますが、コードの再公開はハウスルールに従う必要があります。

免責事項
これらの情報および投稿は、TradingViewが提供または承認する金融、投資、取引、またはその他の種類の助言もしくは推奨であることを意図したものではなく、またこれらに該当するものでもありません。詳細は利用規約をご覧ください。
オープンソーススクリプト
TradingViewの精神に則り、このスクリプトの作者はコードをオープンソースとして公開してくれました。トレーダーが内容を確認・検証できるようにという配慮です。作者に拍手を送りましょう!無料で利用できますが、コードの再公開はハウスルールに従う必要があります。
免責事項
これらの情報および投稿は、TradingViewが提供または承認する金融、投資、取引、またはその他の種類の助言もしくは推奨であることを意図したものではなく、またこれらに該当するものでもありません。詳細は利用規約をご覧ください。