OPEN-SOURCE SCRIPT
Range Breakout Strategy (Candle Close/ Any Break) + P&L
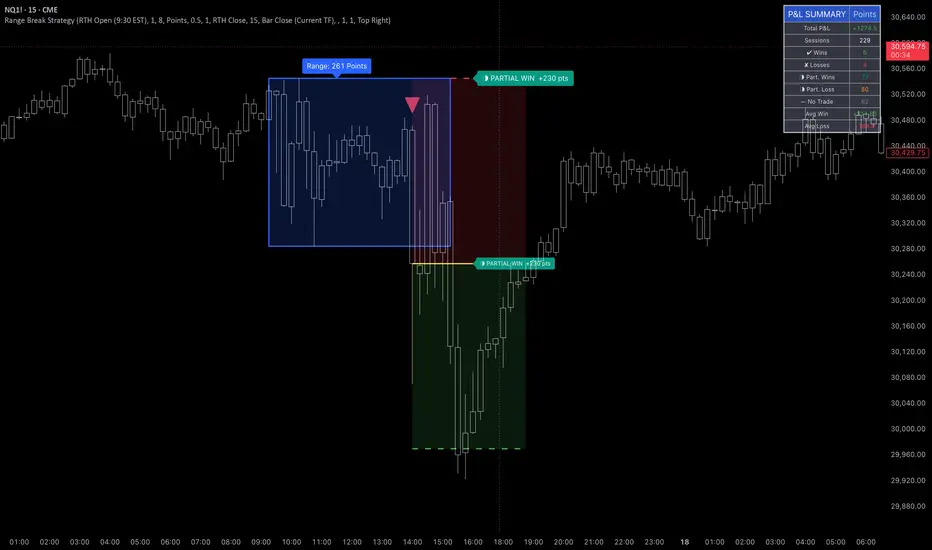
This script defines your chosen range (in candles) based on a candle close or any range break. This can be changed in the settings. The default is candle close - please change it to any range break if you want. As of now, candle close setting on NQ seems more profitable, but this of course will depend on the underlying and also the range of your choosing.
The yellow line shows your entry point. You can of course edit line colors etc. in the settings. The dashed lines show your stop loss (red) and profit target (green).
Then, the script calculates the P&L for your strategy. You can play with the settings and dates to calculate the P&L and see it change in real time in the stats table as you do so.
I took care to calculate partial wins and losses as well, which is all indicated on the chart.
I hope you find this useful.
Happy trading,
~ Ava ~
The yellow line shows your entry point. You can of course edit line colors etc. in the settings. The dashed lines show your stop loss (red) and profit target (green).
Then, the script calculates the P&L for your strategy. You can play with the settings and dates to calculate the P&L and see it change in real time in the stats table as you do so.
I took care to calculate partial wins and losses as well, which is all indicated on the chart.
I hope you find this useful.
Happy trading,
~ Ava ~
オープンソーススクリプト
TradingViewの精神に則り、このスクリプトの作者はコードをオープンソースとして公開してくれました。トレーダーが内容を確認・検証できるようにという配慮です。作者に拍手を送りましょう!無料で利用できますが、コードの再公開はハウスルールに従う必要があります。

免責事項
これらの情報および投稿は、TradingViewが提供または承認する金融、投資、取引、またはその他の種類の助言もしくは推奨であることを意図したものではなく、またこれらに該当するものでもありません。詳細は利用規約をご覧ください。
オープンソーススクリプト
TradingViewの精神に則り、このスクリプトの作者はコードをオープンソースとして公開してくれました。トレーダーが内容を確認・検証できるようにという配慮です。作者に拍手を送りましょう!無料で利用できますが、コードの再公開はハウスルールに従う必要があります。
免責事項
これらの情報および投稿は、TradingViewが提供または承認する金融、投資、取引、またはその他の種類の助言もしくは推奨であることを意図したものではなく、またこれらに該当するものでもありません。詳細は利用規約をご覧ください。