OPEN-SOURCE SCRIPT
更新済 Previous Day High and Low + Separators Daily/Weekly (Lubin Ver.)
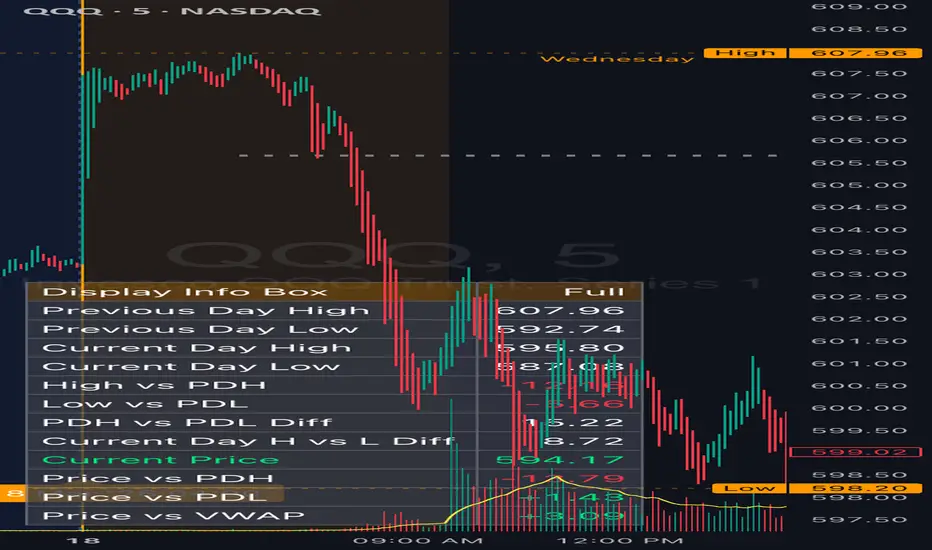
help you with HOD and LOD. if you like or see issue feel free to let me know your opinion.
リリースノート
This indicator marks each new trading day and week with clear separator lines, making it easier to read market structure and organize price action on your chart. It also automatically plots the Previous Day High (PDH) and Previous Day Low (PDL), helping traders identify key support and resistance levels, liquidity zones, and important areas where price may react, reject, or break out. Daily labels improve chart readability, while customizable colors, line styles, widths, and UTC offset settings let you match the indicator to your own trading setup. It is especially useful for intraday traders, scalpers, and price action traders who want a cleaner view of session transitions and prior-day key levels.Here’s a shorter version too:
Marks daily and weekly chart separations while automatically plotting the Previous Day High and Previous Day Low. Designed to help traders quickly spot key levels, session changes, and potential reaction zones for intraday trading, scalping, and price action analysis.
And here’s a more polished sales-style version:
A clean market structure tool that separates each trading day and week while highlighting the Previous Day High and Previous Day Low. Built for traders who want fast visual reference points for session changes, important liquidity levels, and high-probability reaction zones. Fully customizable to fit any chart style or trading workflow.
リリースノート
This indicator helps traders clearly track market structure by marking daily and weekly session changes while automatically plotting the Previous Day High (PDH) and Previous Day Low (PDL). It also includes a live bottom-left info box that displays real-time values for previous-day levels, current-day high and low, and price-distance calculations versus PDH and PDL. Designed for intraday traders, scalpers, and price action traders, it makes it easier to spot key support and resistance zones, liquidity areas, breakout levels, and session-to-session context at a glance. With customizable styles, colors, sizing, and display modes, it gives traders a cleaner and more informative chart for faster decision-making.リリースノート
This indicator helps traders clearly track market structure by marking daily and weekly session changes while automatically plotting the Previous Day High (PDH) and Previous Day Low (PDL). It also includes a live bottom-left info box that displays real-time values for previous-day levels, current-day high and low, and price-distance calculations versus PDH and PDL. Designed for intraday traders, scalpers, and price action traders, it makes it easier to spot key support and resistance zones, liquidity areas, breakout levels, and session-to-session context at a glance. With customizable styles, colors, sizing, and display modes, it gives traders a cleaner and more informative chart for faster decision-making.オープンソーススクリプト
TradingViewの精神に則り、このスクリプトの作者はコードをオープンソースとして公開してくれました。トレーダーが内容を確認・検証できるようにという配慮です。作者に拍手を送りましょう!無料で利用できますが、コードの再公開はハウスルールに従う必要があります。

免責事項
これらの情報および投稿は、TradingViewが提供または承認する金融、投資、取引、またはその他の種類の助言もしくは推奨であることを意図したものではなく、またこれらに該当するものでもありません。詳細は利用規約をご覧ください。
オープンソーススクリプト
TradingViewの精神に則り、このスクリプトの作者はコードをオープンソースとして公開してくれました。トレーダーが内容を確認・検証できるようにという配慮です。作者に拍手を送りましょう!無料で利用できますが、コードの再公開はハウスルールに従う必要があります。
免責事項
これらの情報および投稿は、TradingViewが提供または承認する金融、投資、取引、またはその他の種類の助言もしくは推奨であることを意図したものではなく、またこれらに該当するものでもありません。詳細は利用規約をご覧ください。