OPEN-SOURCE SCRIPT
更新済 Blue Moons Monthly and Quarterly/Seasonal 2000 thru 2035 EST
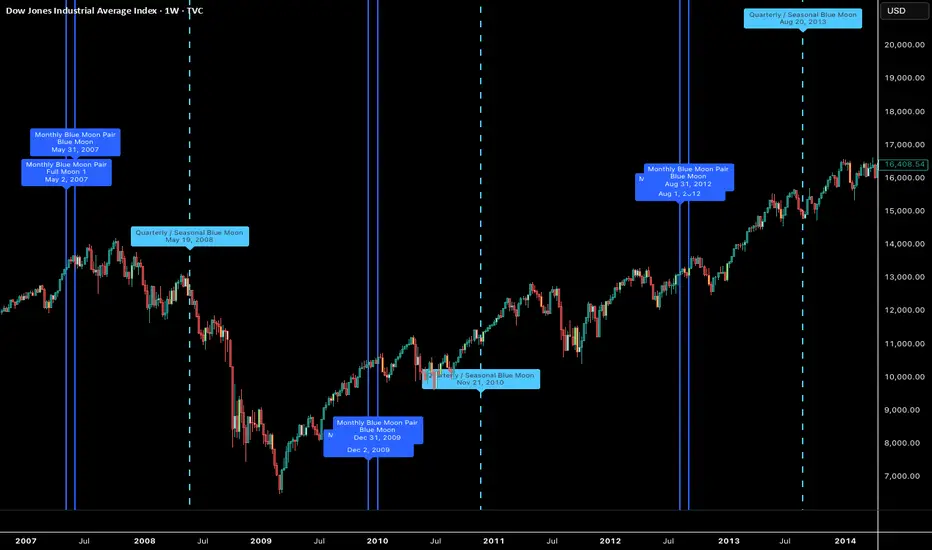
This indicator marks historical and projected Blue Moon events on the chart from 2000 through 2035, using fixed Eastern Standard Time (EST / UTC−5).
The script includes both major Blue Moon definitions:
Monthly Blue Moons
A monthly Blue Moon occurs when there are two Full Moons in the same calendar month. This script marks both Full Moons in each Blue Moon month with solid blue vertical lines.
Quarterly / Seasonal Blue Moons
A quarterly or seasonal Blue Moon occurs when an astronomical season contains four Full Moons instead of the usual three. The Blue Moon is the third Full Moon in that season. These are marked with dashed light-blue vertical lines.
The purpose of this indicator is to help visually study potential market correlations around rare lunar timing events. It is designed for historical research, cycle analysis, and astro-financial timing studies.
The script includes both major Blue Moon definitions:
Monthly Blue Moons
A monthly Blue Moon occurs when there are two Full Moons in the same calendar month. This script marks both Full Moons in each Blue Moon month with solid blue vertical lines.
Quarterly / Seasonal Blue Moons
A quarterly or seasonal Blue Moon occurs when an astronomical season contains four Full Moons instead of the usual three. The Blue Moon is the third Full Moon in that season. These are marked with dashed light-blue vertical lines.
The purpose of this indicator is to help visually study potential market correlations around rare lunar timing events. It is designed for historical research, cycle analysis, and astro-financial timing studies.
リリースノート
Prior Script was not printing the future events - correction here. オープンソーススクリプト
TradingViewの精神に則り、このスクリプトの作者はコードをオープンソースとして公開してくれました。トレーダーが内容を確認・検証できるようにという配慮です。作者に拍手を送りましょう!無料で利用できますが、コードの再公開はハウスルールに従う必要があります。

免責事項
これらの情報および投稿は、TradingViewが提供または承認する金融、投資、取引、またはその他の種類の助言もしくは推奨であることを意図したものではなく、またこれらに該当するものでもありません。詳細は利用規約をご覧ください。
オープンソーススクリプト
TradingViewの精神に則り、このスクリプトの作者はコードをオープンソースとして公開してくれました。トレーダーが内容を確認・検証できるようにという配慮です。作者に拍手を送りましょう!無料で利用できますが、コードの再公開はハウスルールに従う必要があります。
免責事項
これらの情報および投稿は、TradingViewが提供または承認する金融、投資、取引、またはその他の種類の助言もしくは推奨であることを意図したものではなく、またこれらに該当するものでもありません。詳細は利用規約をご覧ください。