ASLC Visual Dashboard - VDUAE
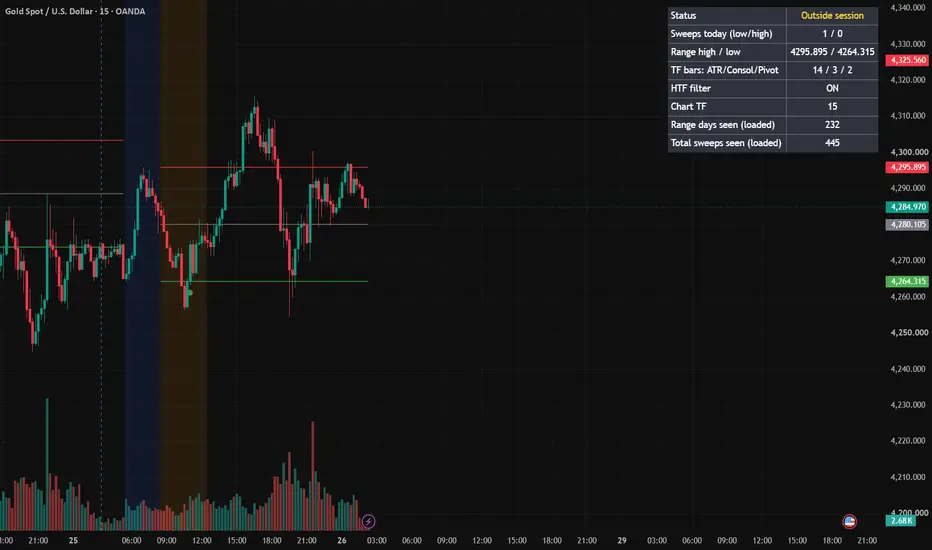
ASLC Visual Dashboard — Asian Session XAUUSD
A visual analysis tool for reading Asian-session liquidity sweeps on Gold (XAUUSD), built around a simple but often-overlooked idea: price frequently sweeps a session's range boundary more than once before the real directional move happens.
How it works
Splits the Asian session into two phases: a range-formation window (default 00:00–03:00 UTC) where the high/low lock in, and a trade window (default 03:00–07:00 UTC) where the logic watches for reactions at those levels.
Counts every time price wicks beyond the range high or low and closes back inside it — one full round trip is a "sweep."
Once a chosen number of sweeps on the same side complete (default: 2), the setup arms — background shades lime (bullish) or fuchsia (bearish), and a stop-loss locks in based on that sweep's extreme.
Optionally waits for a brief consolidation, then looks for a break of recent structure in the armed direction to trigger a labeled entry signal with SL/TP1/TP2 printed on the chart.
Includes an optional 1H EMA trend filter so signals can be required to align with the higher-timeframe direction.
What you'll see
Blue background — range still forming
Orange background — trade window open, watching
Lime / fuchsia background — cascade armed long / short, waiting for confirmation
Green / red dots — completed sweep cycles
Triangle + label — confirmed entry with SL/TP1/TP2
Live dashboard (top-right) — current status, sweep counts, range levels, and settings at a glance
Timeframe-adaptive
Key lookbacks (ATR window, consolidation window, structure-confirmation window) are set in minutes and auto-convert to bars for whatever intraday timeframe you're on, so the same settings behave consistently across 5m, 15m, or 1H. Built for intraday charts only — a single 4H or Daily bar spans the whole session, so it won't produce anything meaningful there.
Note
This is a visual/analysis tool, not a backtested strategy — it does not simulate trades or produce performance statistics. Use it to study how price behaves around session liquidity, and validate any setup with your own testing before trading it live. Not financial advice.
#gold#xau/usd
A visual analysis tool for reading Asian-session liquidity sweeps on Gold (XAUUSD), built around a simple but often-overlooked idea: price frequently sweeps a session's range boundary more than once before the real directional move happens.
How it works
Splits the Asian session into two phases: a range-formation window (default 00:00–03:00 UTC) where the high/low lock in, and a trade window (default 03:00–07:00 UTC) where the logic watches for reactions at those levels.
Counts every time price wicks beyond the range high or low and closes back inside it — one full round trip is a "sweep."
Once a chosen number of sweeps on the same side complete (default: 2), the setup arms — background shades lime (bullish) or fuchsia (bearish), and a stop-loss locks in based on that sweep's extreme.
Optionally waits for a brief consolidation, then looks for a break of recent structure in the armed direction to trigger a labeled entry signal with SL/TP1/TP2 printed on the chart.
Includes an optional 1H EMA trend filter so signals can be required to align with the higher-timeframe direction.
What you'll see
Blue background — range still forming
Orange background — trade window open, watching
Lime / fuchsia background — cascade armed long / short, waiting for confirmation
Green / red dots — completed sweep cycles
Triangle + label — confirmed entry with SL/TP1/TP2
Live dashboard (top-right) — current status, sweep counts, range levels, and settings at a glance
Timeframe-adaptive
Key lookbacks (ATR window, consolidation window, structure-confirmation window) are set in minutes and auto-convert to bars for whatever intraday timeframe you're on, so the same settings behave consistently across 5m, 15m, or 1H. Built for intraday charts only — a single 4H or Daily bar spans the whole session, so it won't produce anything meaningful there.
Note
This is a visual/analysis tool, not a backtested strategy — it does not simulate trades or produce performance statistics. Use it to study how price behaves around session liquidity, and validate any setup with your own testing before trading it live. Not financial advice.
#gold#xau/usd

免責事項
これらの情報および投稿は、TradingViewが提供または承認する金融、投資、取引、またはその他の種類の助言もしくは推奨であることを意図したものではなく、またこれらに該当するものでもありません。詳細は利用規約をご覧ください。
免責事項
これらの情報および投稿は、TradingViewが提供または承認する金融、投資、取引、またはその他の種類の助言もしくは推奨であることを意図したものではなく、またこれらに該当するものでもありません。詳細は利用規約をご覧ください。