OPEN-SOURCE SCRIPT
更新済 RSI Return Study
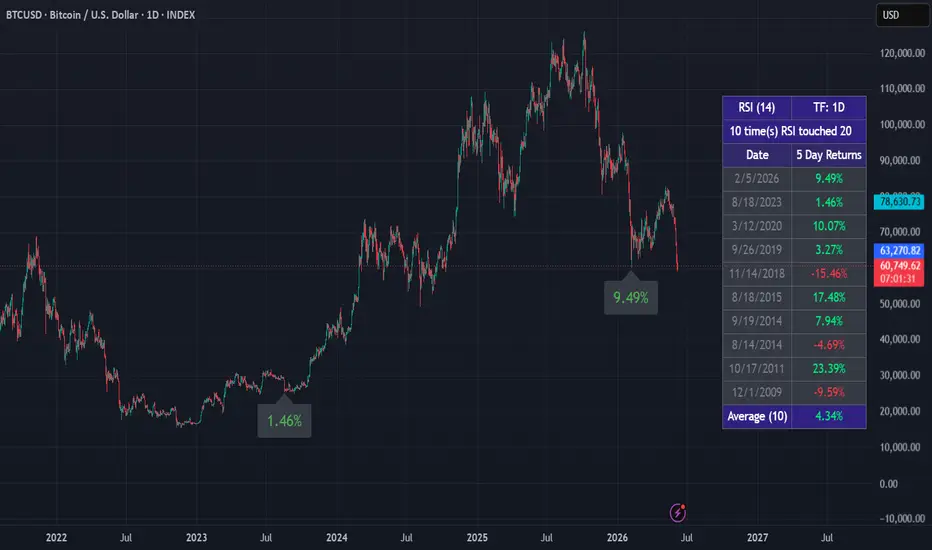
Ever wonder what happens after the RSI hits an extreme level on your favorite ticker? This indicator answers that question historically.
What it does:
How to use:
Notes:
What it does:
- Finds every instance where the RSI crossed a user-defined trigger level
- Measures the forward price return N trading days later
- Displays each signal date and return in a clean table
- Plots labels on the chart at each signal location
- Shows the average return across all historical signals
How to use:
- Set "When RSI Touches..." to your oversold level (e.g. 25) or overbought level (e.g. 75)
- Set "Calculate Return Days Later" to how many trading days forward you want to measure
- Works on any timeframe — bar count is automatically calculated for you
- Adjust "Max Results/Labels to Display" to control how much shows on the chart
Notes:
- All signals are included in the average regardless of the display limit
- Set "Min Bars Between Signals" to 0 to count every RSI cross, or increase it to reduce clustering during volatile periods
リリースノート
Added the ability to see more than one forward return. For example, can now input"1D,3D,7D" or
"5D,1M,3M,6M,1Y"
Can support up to 5 forward returns.
オープンソーススクリプト
TradingViewの精神に則り、このスクリプトの作者はコードをオープンソースとして公開してくれました。トレーダーが内容を確認・検証できるようにという配慮です。作者に拍手を送りましょう!無料で利用できますが、コードの再公開はハウスルールに従う必要があります。

免責事項
これらの情報および投稿は、TradingViewが提供または承認する金融、投資、取引、またはその他の種類の助言もしくは推奨であることを意図したものではなく、またこれらに該当するものでもありません。詳細は利用規約をご覧ください。
オープンソーススクリプト
TradingViewの精神に則り、このスクリプトの作者はコードをオープンソースとして公開してくれました。トレーダーが内容を確認・検証できるようにという配慮です。作者に拍手を送りましょう!無料で利用できますが、コードの再公開はハウスルールに従う必要があります。
免責事項
これらの情報および投稿は、TradingViewが提供または承認する金融、投資、取引、またはその他の種類の助言もしくは推奨であることを意図したものではなく、またこれらに該当するものでもありません。詳細は利用規約をご覧ください。