OPEN-SOURCE SCRIPT
S&P500 ETF Confluence Table
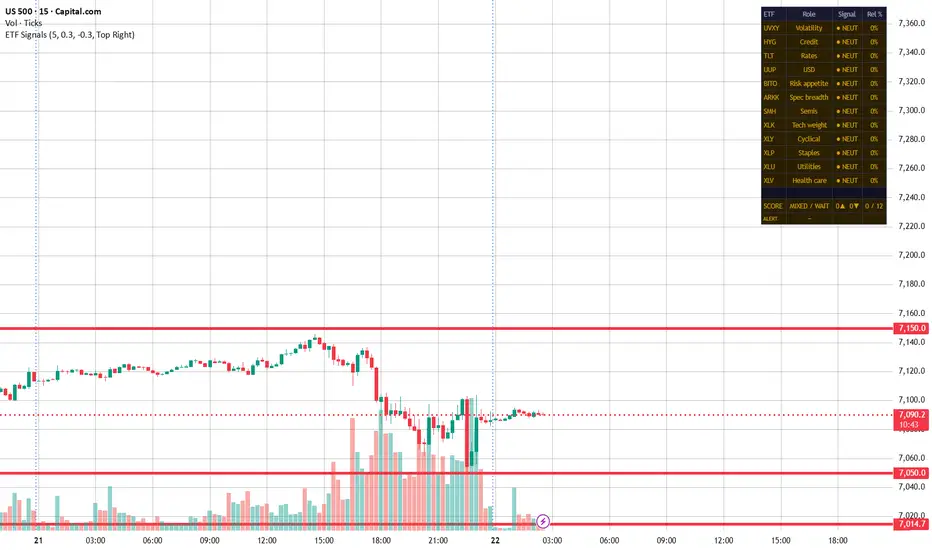
S&P500 ETF Confluence Signal Table — Indicator Description
This indicator monitors 12 carefully selected ETFs in real time and scores them collectively to determine the directional bias for S&P500 options trading. It displays as a compact table overlay on your chart, updating automatically on every bar close.
How the scoring works
Each ETF is measured by its % change relative to SPY over a configurable lookback period (default 5 bars). Based on that relative strength, each ETF is assigned one of three states: BULL (+1), BEAR (-1), or NEUTRAL (0). The 12 scores are summed into a total confluence score ranging from -12 to +12.
+6 to +12 → Strong bullish confluence — favor call spreads or short puts on SPY/SPX
+3 to +5 → Mild bullish lean — cautious calls, smaller size
-3 to +3 → Mixed / no edge — stay flat or reduce size significantly
-3 to -5 → Mild bearish lean — cautious puts, smaller size
-6 to -12 → Strong bearish confluence — favor put spreads or short calls on SPY/SPX
The 12 ETFs and what they measure
UVXY — Volatility / Fear gauge
Measures market fear directly. Rising UVXY = elevated fear = bearish signal for equities. Falling UVXY = calm market = bullish signal. This is the most sensitive indicator in the table and is measured on an absolute basis, not relative to SPY.
HYG — High yield credit
Junk bonds are the earliest warning system for equity stress. HYG outperforming SPY = credit markets healthy = bullish. HYG diverging lower from SPY = credit stress building = early bearish warning, often before the index itself drops.
TLT — 20+ Year Treasury bonds
Measures flight-to-safety behavior. TLT surging while equities hold or fall = institutions buying safety = bearish. TLT falling alongside SPY = rates-driven selloff rather than a flight to safety, which changes the options strategy context.
UUP — US Dollar index
A strengthening dollar pressures multinational earnings and risk assets broadly. UUP rising = headwind for S&P rally = bearish signal. UUP weakening = tailwind for risk assets = bullish signal.
BITO — Bitcoin / Risk appetite
Crypto acts as a leading edge of risk appetite. BITO outperforming SPY = speculative money flowing into risk = bullish confirmation. BITO collapsing ahead of SPY = early risk-off warning, historically a leading signal for equity pullbacks.
ARKK — Speculative / growth breadth
Measures the breadth of institutional risk-taking in high-growth names. ARKK leading SPY = liquidity is abundant and risk appetite is wide = bullish. ARKK lagging badly while SPY holds = breadth is narrowing = rally is fragile and high-risk for call buyers.
SMH — Semiconductors
Semis are the most cyclically sensitive subsector and historically lead S&P500 turns. SMH outperforming XLK = broad tech momentum is healthy = bullish. SMH breaking while XLK holds = early warning that tech is about to roll over.
XLK — Technology sector weight
Technology represents approximately 30% of the S&P500. XLK leading = the index has its largest engine firing = bullish. XLK lagging = the index is being carried by other sectors, which is a lower-conviction setup for calls.
XLY — Consumer Discretionary vs XLP spread
This row measures the XLY minus XLP relative strength spread — the single most reliable rotation signal in the table. XLY outperforming XLP = consumers are spending on wants, not just needs = risk-on. XLP outperforming XLY = defensive rotation is underway = reduce call exposure immediately.
XLP — Consumer Staples
Confirms the XLY rotation signal from the other side. XLP outperforming SPY = institutions are hiding in defensive names = bearish. XLP lagging SPY = no defensive bid = bullish confirmation.
XLU — Utilities
Rate-sensitive and deeply defensive. XLU surging, especially alongside TLT = flight-to-yield behavior = bearish for growth equities. XLU lagging = no utility bid = market is not in risk-off mode.
XLV — Health Care
The most stable defensive sector. XLV rotating in while tech and cyclicals fade = late-cycle or risk-off institutional behavior = bearish lean. XLV lagging the broader market = no late-cycle rotation = neutral to bullish context.
Special confluence alerts
Beyond the score, the table watches for five specific multi-ETF combinations that historically precede strong directional moves:
Credit stress (UVXY spiking + HYG falling) — highest conviction bearish setup; consider put spreads immediately
Flight to safety (TLT surging + HYG falling) — confirmed risk-off; defensive positioning warranted
Breadth divergence (XLY bullish but ARKK lagging) — rally is narrow and fragile; reduce size, do not chase calls
Semi leading down (SMH breaking while XLK holds) — early warning; watch for XLK to follow semis lower
Clean risk-on (XLP lagging + XLY leading + SMH outperforming) — all three rotation signals aligned bullish; highest conviction call spread setup
Practical usage rules
Only take directional options trades when 8 or more of 12 signals align in one direction
Between 5–7 signals aligned — reduce position size by at least 50%
Below 5 signals in either direction — stay flat or sell premium rather than buy directional
Always check the ALERT row first — a special confluence condition overrides a borderline score
On high-VIX days, prefer spreads over naked directional buying regardless of score — the UVXY signal helps identify this
Settings
Lookback (bars) — default 5. On a 5-minute chart this equals 25 minutes of relative strength. Increase to 10–20 for smoother, less noisy signals on choppy days
Bullish / Bearish threshold (%) — default ±0.3%. Tighten to ±0.15% on low-volatility days for more sensitivity; widen to ±0.5% on high-volatility days to filter noise
Table position — move to any corner to suit your chart layout
オープンソーススクリプト
TradingViewの精神に則り、このスクリプトの作者はコードをオープンソースとして公開してくれました。トレーダーが内容を確認・検証できるようにという配慮です。作者に拍手を送りましょう!無料で利用できますが、コードの再公開はハウスルールに従う必要があります。

免責事項
これらの情報および投稿は、TradingViewが提供または承認する金融、投資、取引、またはその他の種類の助言もしくは推奨であることを意図したものではなく、またこれらに該当するものでもありません。詳細は利用規約をご覧ください。
オープンソーススクリプト
TradingViewの精神に則り、このスクリプトの作者はコードをオープンソースとして公開してくれました。トレーダーが内容を確認・検証できるようにという配慮です。作者に拍手を送りましょう!無料で利用できますが、コードの再公開はハウスルールに従う必要があります。
免責事項
これらの情報および投稿は、TradingViewが提供または承認する金融、投資、取引、またはその他の種類の助言もしくは推奨であることを意図したものではなく、またこれらに該当するものでもありません。詳細は利用規約をご覧ください。