アップデート済
[blackcat] L1 OBV-MFI Combo
Level 1
Background
As requested, this is a combo of OBV and MFI indicators
Function
On-balance volume (OBV) is a technical trading momentum indicator that uses volume flow to predict changes in stock price. Joseph Granville first developed the OBV metric in the 1963 book Granville's New Key to Stock Market Profits.
The Money Flow Index (MFI) is a technical oscillator that uses price and volume data for identifying overbought or oversold signals in an asset. It can also be used to spot divergences which warn of a trend change in price. The oscillator moves between 0 and 100.
The combo of them is still an oscillator.
Remarks
Feedbacks are appreciated.
Background
As requested, this is a combo of OBV and MFI indicators
Function
On-balance volume (OBV) is a technical trading momentum indicator that uses volume flow to predict changes in stock price. Joseph Granville first developed the OBV metric in the 1963 book Granville's New Key to Stock Market Profits.
The Money Flow Index (MFI) is a technical oscillator that uses price and volume data for identifying overbought or oversold signals in an asset. It can also be used to spot divergences which warn of a trend change in price. The oscillator moves between 0 and 100.
The combo of them is still an oscillator.
Remarks
Feedbacks are appreciated.
リリースノート
OVERVIEWThe [blackcat] L1 OBV-MFI Combo indicator combines On-Balance Volume (OBV) and Money Flow Index (MFI) to provide a comprehensive view of market momentum and volume trends. This indicator calculates a unique OBV-MFI signal and plots it alongside a trigger signal, helping traders identify potential buy and sell opportunities. With customizable bands and visual labels, it offers a clear representation of market sentiment 📈💹.
FEATURES
Combines OBV and MFI to create a unique momentum indicator 📊
Plots OBV-MFI Signal and Trigger Signal lines for easy visualization:
OBV-MFI Signal: Yellow line representing combined OBV-MFI values.
Trigger Signal: Fuchsia line acting as a reference for crossover signals.
Includes customizable upper, middle, and lower bands for better context:
Upper Band: 80 level (blue).
Middle Band: 50 level (gray).
Lower Band: 20 level (blue).
Displays buy ('Buy') and sell ('Sell') labels on the chart for quick identification 🏷️
Generates alerts based on crossover events between the OBV-MFI Signal and Trigger Signal 🔔
HOW TO USE
Add the indicator to your TradingView chart by selecting it from the indicators list.
Adjust the Length parameter to suit your preferred sensitivity.
Monitor the chart for buy and sell labels indicating potential trade opportunities.
Set up alerts based on the generated signals to receive notifications when conditions are met 📲.
Use the bands as additional context for market sentiment analysis.
LIMITATIONS
The indicator may generate false signals in highly volatile or ranging markets 🌪️.
Users should combine this indicator with other forms of analysis for more reliable trading decisions.
The effectiveness of the indicator may vary depending on the asset and timeframe being analyzed.
NOTES
Ensure that you have sufficient historical data available for accurate calculations.
Test the indicator thoroughly on demo accounts before applying it to live trading 🔍.
Customize the appearance and parameters as needed to fit your trading strategy.
リリースノート
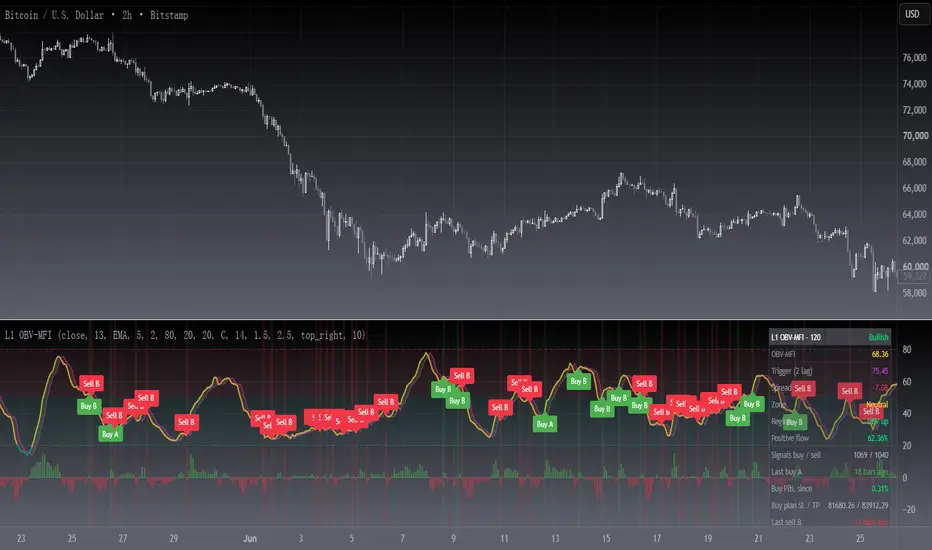
█ OVERVIEWL1 OBV-MFI Combo reads accumulation and distribution through an On-Balance-Volume version of the Money Flow Index, then confirms every cross with the OBV trend and grades it A, B or C. A live status table reports level, zone, regime, signal age and an ATR-based trade plan.
█ CONCEPTS
The oscillator sums signed volume inside a rolling window and shows the positive share as a 0-100 line, so it measures real money flow instead of price-only momentum. A lagged copy of the smoothed line acts as the trigger; when the two cross, the flow balance has turned.
Key principles:
• Positive flow is volume on up bars, negative flow is volume on down bars. The ratio is bounded, never negative and never divides by zero.
• The OBV line against its own average defines the regime. Signals aligned with it are trusted; counter-regime crosses are downgraded or filtered out.
• Grade A means the regime agrees and the cross launches from an extreme zone; B means one of the two; C means neither.
█ HOW TO USE
1 — Add the indicator to any market and timeframe. The defaults (length 13, EMA 5, lag 2) work on intraday and swing charts alike.
2 — Read the Buy and Sell labels. The letter behind the word is the grade; raise "Minimum signal grade" to A in choppy markets.
3 — Trade in the direction of the Regime row. The SL / TP rows carry ATR multiples for the most recent signal, so the plan travels with the alert.
Input Parameters
• Flow source and HLC3 direction toggle: the series whose change signs the volume.
• Flow length 13, Smoothing type and length (EMA 5), Trigger lag 2 bars.
• Overbought 80 and Oversold 20 levels.
• OBV regime length 20, regime filter on, Minimum signal grade C.
• ATR length 14 with stop 1.5 and target 2.5 ATR multiples.
• Visual toggles, table position and table text size.
█ FEATURES
• Colour-coded signal line: yellow in the middle, teal in oversold, red in overbought, with a fuchsia trigger line.
• Spread histogram of signal minus trigger, green above zero, red below.
• Ribbon fill between the two lines, zone shading, and a background flash on every accepted signal.
• Status table: level, trigger, spread, zone, regime, positive-flow share, buy and sell counts, bars since each signal, P&L since signal, and the SL / TP plan.
• Eight alertconditions: graded Buy and Sell, Grade-A only variants, raw cross up and down, plus overbought and oversold entries.
█ IMPLEMENTATION NOTES
Built on ta.change, math.sign, math.sum, ta.ema / sma / wma / rma, ta.cum, ta.atr, ta.crossover and ta.barssince.
The earlier revision summed a cumulative OBV value inside a rolling window and multiplied it by price, which skewed the ratio, could push the oscillator outside 0-100 and divided by zero when one leg was empty. This revision sums the per-bar OBV delta, keeps both legs non-negative and guards every division. Signals are evaluated on closed bars only, so they do not repaint.
█ LIMITATIONS
• Volume based: needs a real volume feed. Low-liquidity or volume-less symbols give a weak reading.
• The trigger is a lagged copy, so a cross confirms a turn that has already begun rather than predicting one.
• Grade C signals repeat often inside strong trends; keep the regime filter on unless you are fading extremes.
█ NOTES
• Follows the classic OBV-MFI idea, rewritten for Pine v6 with grading, a regime filter and on-chart reporting.
• Mozilla Public License 2.0 — reuse and modification allowed, attribution appreciated.
═════════════════════════════════════════════════════════════════════════
For questions or feedback, use the comments section below.

Don't miss out! The first and most important thing to do is to join my Discord chat now! Click here to start your adventure: discord.com/invite/ZTGpQJq My new github for more pine development soon: github.com/wxt-coder
免責事項
これらの情報および投稿は、TradingViewが提供または承認する金融、投資、取引、またはその他の種類の助言もしくは推奨であることを意図したものではなく、またこれらに該当するものでもありません。詳細は利用規約をご覧ください。
Don't miss out! The first and most important thing to do is to join my Discord chat now! Click here to start your adventure: discord.com/invite/ZTGpQJq My new github for more pine development soon: github.com/wxt-coder
免責事項
これらの情報および投稿は、TradingViewが提供または承認する金融、投資、取引、またはその他の種類の助言もしくは推奨であることを意図したものではなく、またこれらに該当するものでもありません。詳細は利用規約をご覧ください。