アップデート済
Crude Oil CL1 / CL2 Spread Box WW
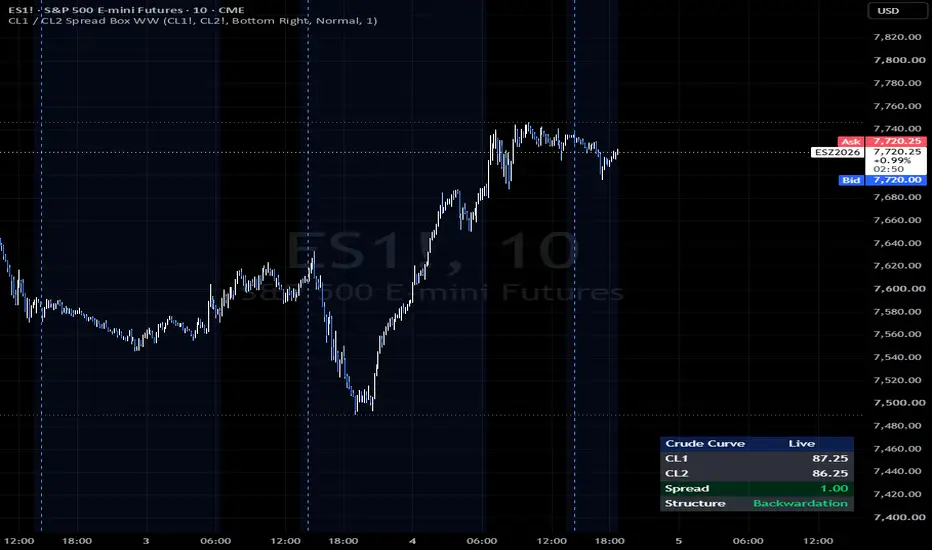
### Overview & Use Case
The CL1 / CL2 Spread Box WW indicator provides an on-chart heads-up display (HUD) designed to track term structure dynamics in the energy futures market. By monitoring the front-month contract alongside the second consecutive contract, traders gain real-time insight into the supply-and-demand fundamentals driving the prompt physical market without switching tabs or splitting screen real estate.
- Backwardation (Spread > 0): Near-term demand outpaces immediate available supply, creating a positive roll yield and prompt price premium.
- Contango (Spread < 0): Supply conditions are comfortable or storage costs dominate, discounting near-term contracts relative to deferred months.
---
### Key Features
- Live Multi-Asset Monitoring: Fetches real-time front-month (CL1!) and back-month (CL2!) prices using non-repainting, continuous resolution data calls.
- Real-Time Spread Calculation & State Flag: Computes continuous price differentials (CL1 - CL2) and dynamically categorizes the market state as Backwardation, Contango, or Flat.
- Configurable HUD Styling & Sizing:
* Text Size Selector: Standardized dropdown controls allowing selection between Auto, Tiny, Small, Normal, Large, and Huge.
* Corner Docking: Position the HUD in any corner of the chart (Top Right, Top Left, Bottom Right, Bottom Left).
* Vertical Offset Control: Built-in row spacer buffer (0 to 10) to shift the HUD up or down. This prevents overlap with top-docked UI elements (such as chart status lines and ticker headers) or bottom UI elements (such as the TradingView logo and bottom scale margins).
* Visual Accents: Optional row toggles for header, structure indicator, and conditional spread color-fill.
- Automated Curve Alerts: Native alert conditions trigger the moment the spread crosses above or below zero, alerting you instantly to curve structure flips.
---
### Monitoring Additional Pairs & Arbitrage Spreads
While pre-configured for Crude Oil futures (NYMEX:CL1! vs. NYMEX:CL2!), the symbol inputs are fully customizable.
Because both asset fields can be changed to any valid ticker, you can add this indicator to the chart multiple times to track alternative pair spreads simultaneously:
- Brent / WTI Arb: Compare ICEEUR:B1! against NYMEX:CL1!.
- Refined Product Crack Spreads: Monitor gasoline (NYMEX:RB1!) or heating oil (NYMEX:HO1!) relative to crude.
- Deferred Calendar Spreads: Track 3-month or 6-month spreads (e.g., CL1! vs. CL6!) or other commodity curves like Natural Gas (NYMEX:NG1! vs. NYMEX:NG2!).
By assigning each indicator instance a distinct corner anchor (Top Left, Top Right, Bottom Left, or Bottom Right) and dialing in the vertical offset buffers, you can construct a multi-asset dashboard directly on your execution chart.
The CL1 / CL2 Spread Box WW indicator provides an on-chart heads-up display (HUD) designed to track term structure dynamics in the energy futures market. By monitoring the front-month contract alongside the second consecutive contract, traders gain real-time insight into the supply-and-demand fundamentals driving the prompt physical market without switching tabs or splitting screen real estate.
- Backwardation (Spread > 0): Near-term demand outpaces immediate available supply, creating a positive roll yield and prompt price premium.
- Contango (Spread < 0): Supply conditions are comfortable or storage costs dominate, discounting near-term contracts relative to deferred months.
---
### Key Features
- Live Multi-Asset Monitoring: Fetches real-time front-month (CL1!) and back-month (CL2!) prices using non-repainting, continuous resolution data calls.
- Real-Time Spread Calculation & State Flag: Computes continuous price differentials (CL1 - CL2) and dynamically categorizes the market state as Backwardation, Contango, or Flat.
- Configurable HUD Styling & Sizing:
* Text Size Selector: Standardized dropdown controls allowing selection between Auto, Tiny, Small, Normal, Large, and Huge.
* Corner Docking: Position the HUD in any corner of the chart (Top Right, Top Left, Bottom Right, Bottom Left).
* Vertical Offset Control: Built-in row spacer buffer (0 to 10) to shift the HUD up or down. This prevents overlap with top-docked UI elements (such as chart status lines and ticker headers) or bottom UI elements (such as the TradingView logo and bottom scale margins).
* Visual Accents: Optional row toggles for header, structure indicator, and conditional spread color-fill.
- Automated Curve Alerts: Native alert conditions trigger the moment the spread crosses above or below zero, alerting you instantly to curve structure flips.
---
### Monitoring Additional Pairs & Arbitrage Spreads
While pre-configured for Crude Oil futures (NYMEX:CL1! vs. NYMEX:CL2!), the symbol inputs are fully customizable.
Because both asset fields can be changed to any valid ticker, you can add this indicator to the chart multiple times to track alternative pair spreads simultaneously:
- Brent / WTI Arb: Compare ICEEUR:B1! against NYMEX:CL1!.
- Refined Product Crack Spreads: Monitor gasoline (NYMEX:RB1!) or heating oil (NYMEX:HO1!) relative to crude.
- Deferred Calendar Spreads: Track 3-month or 6-month spreads (e.g., CL1! vs. CL6!) or other commodity curves like Natural Gas (NYMEX:NG1! vs. NYMEX:NG2!).
By assigning each indicator instance a distinct corner anchor (Top Left, Top Right, Bottom Left, or Bottom Right) and dialing in the vertical offset buffers, you can construct a multi-asset dashboard directly on your execution chart.
リリースノート
formatting change to allow positive/negative vertical offset values, pushing the chart up from the bottom/down from the top as needed to accommodate status lines or other visual obstructions.
免責事項
これらの情報および投稿は、TradingViewが提供または承認する金融、投資、取引、またはその他の種類の助言もしくは推奨であることを意図したものではなく、またこれらに該当するものでもありません。詳細は利用規約をご覧ください。
免責事項
これらの情報および投稿は、TradingViewが提供または承認する金融、投資、取引、またはその他の種類の助言もしくは推奨であることを意図したものではなく、またこれらに該当するものでもありません。詳細は利用規約をご覧ください。