アップデート済
RSI Scaling (UO)
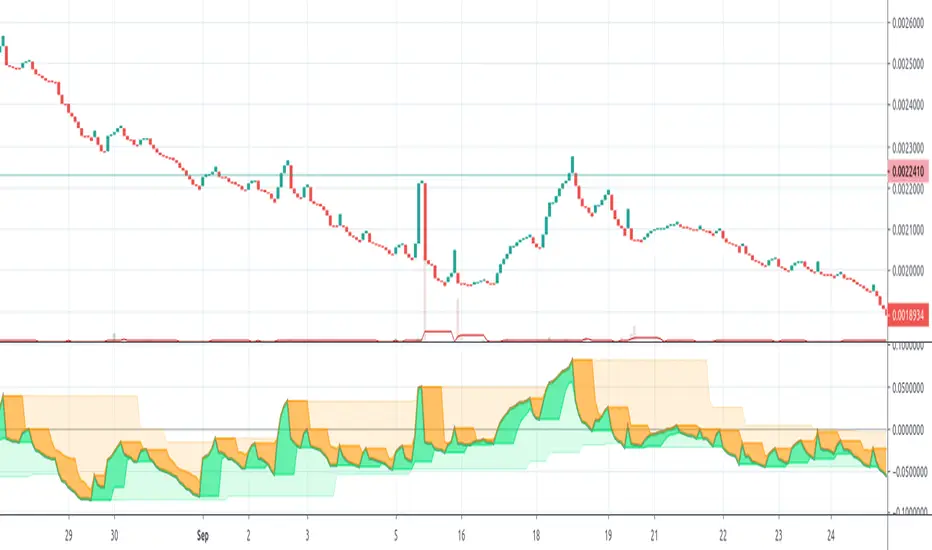
Plot price scaled by the RSI. Also, plot high and low of the scaled price so that the trend is visible as well as sell-high/buy-low points...
Before the prices change direction, RSI generally makes a double top/bottom... Or a lower high/higher low.
This is more emphasized on the scaled price. You can see the high/low band change direction
Before the prices change direction, RSI generally makes a double top/bottom... Or a lower high/higher low.
This is more emphasized on the scaled price. You can see the high/low band change direction
リリースノート
The band is color filled to show the trend clearly...Note that while the price can make a higher high, the scaled price can make a lower high. This is a clear sign of reversal. Same for the other direction
リリースノート
Added an outer color band to emphasize the highest highs and the lowest lows
免責事項
これらの情報および投稿は、TradingViewが提供または承認する金融、投資、取引、またはその他の種類の助言もしくは推奨であることを意図したものではなく、またこれらに該当するものでもありません。詳細は利用規約をご覧ください。
免責事項
これらの情報および投稿は、TradingViewが提供または承認する金融、投資、取引、またはその他の種類の助言もしくは推奨であることを意図したものではなく、またこれらに該当するものでもありません。詳細は利用規約をご覧ください。