OPEN-SOURCE SCRIPT
KRV Adaptive Structure Canvas v1.2 [Trend / Levels / Patterns]
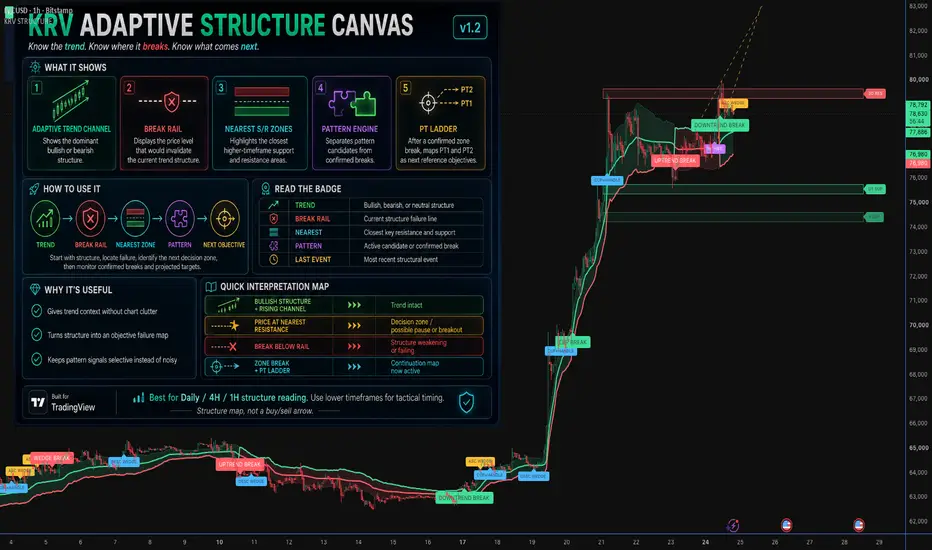
Know the trend. Know where it breaks. Know what comes next.
KRV Adaptive Structure Canvas v1.2 is a visual market-structure framework designed to organize trend, structural invalidation, higher-timeframe support and resistance, pattern confirmation, and post-break price objectives on a single chart.
Rather than covering the chart with multiple moving averages, pivots, trendlines, and repeated pattern labels, KRV Structure compresses those functions into one adaptive structural map.
It is not designed as a standalone buy/sell signal system.
Instead, it is built to answer five practical questions:
1. What is the dominant structure?
2. Where does that structure fail?
3. Where is the nearest meaningful support or resistance?
4. Is a recognizable pattern merely forming, or has it actually confirmed?
5. If a key level breaks, what is the next structural objective?
1. ADAPTIVE TREND CHANNEL
The shaded channel represents the current directional structure.
Its basis uses an adaptive KAMA framework, while channel width adjusts using ATR and trend efficiency. In lower-efficiency conditions, the channel expands so ordinary market noise is less likely to trigger unnecessary structural changes.
Green = bullish structure
Red = bearish structure
Neutral = insufficient directional structure
The goal is not to predict every candle.
The goal is to answer a more useful question:
“Is the current trend structure still intact?”
2. BREAK RAIL
The Break Rail is the script’s primary structural invalidation reference.
During bullish structure, the dashboard may display:
UPTREND BREAK BELOW [price]
During bearish structure:
DOWNTREND BREAK ABOVE [price]
This creates an explicit failure boundary for the active trend instead of relying entirely on subjective visual interpretation.
By default, structural breaks require confirmation rather than reacting to a single touch of the rail.
Think of the Break Rail as the level the current structure should not lose if the trend is going to remain intact.
3. MULTI-HORIZON SUPPORT AND RESISTANCE
KRV Structure automatically maps the nearest relevant support and resistance zones using completed higher-timeframe price data.
Potential sources include:
D1 — Previous daily level
2D — Two-day level
3D — Three-day level
W — Weekly level
M — Monthly level
Y — Yearly level
Only the nearest zones are emphasized by default, which keeps the chart focused rather than filling it with distant horizontal levels.
For example:
3D RES 79,461 | D1 SUP 75,568
means the nearest resistance is derived from the three-day structure, while the nearest support comes from the prior daily structure.
These levels are displayed as zones, not as false-precision single-price predictions.
4. STRUCTURAL PATTERN ENGINE
The script also monitors several common structural formations:
• Bull Flag
• Cup + Handle
• Ascending Wedge
• Descending Wedge
• Head & Shoulders
• Inverse Head & Shoulders
The important distinction is that KRV Structure separates pattern candidates from confirmed pattern breaks.
A recognizable shape alone is not enough.
Patterns must persist long enough to satisfy a maturity requirement, and confirmed events require price to break the relevant flag range, handle, wedge boundary, or neckline.
The engine also uses cooldown periods and pattern-instance tracking to reduce repeated signals from effectively the same formation.
The objective is selective structural recognition, not constant pattern labeling.
5. BREAKOUT PRICE-TARGET LADDER
When price confirms a break through the nearest support or resistance zone, the script can activate a projected:
PT1
PT2
ladder.
PT1 prioritizes the next available structural level when one exists. When an appropriate structural level is unavailable, ATR-based extensions provide fallback reference objectives.
This creates a simple progression:
Structure → Decision Zone → Confirmed Break → Next Objective
PT1 and PT2 are reference levels, not guaranteed price forecasts.
READING THE STRUCTURE BADGE
The upper-left badge is designed to summarize the active market structure in a few seconds.
TREND
Displays the current directional structure:
BULLISH STRUCTURE
BEARISH STRUCTURE
BULLISH / BEARISH FORMING
NEUTRAL / RANGE
BREAK RAIL
Displays the current structural failure boundary.
NEAREST
Shows the closest relevant resistance and support zones.
PATTERN
Shows the highest-priority active pattern candidate or confirmed pattern event.
LAST EVENT
Records the most recent significant structural event and its exchange time.
The chart intentionally limits excessive event stamps, so the badge helps preserve important structural information without adding unnecessary visual clutter.
HOW TO USE KRV STRUCTURE
A simple workflow is:
1. Start with TREND.
Determine whether the dominant structure is bullish, bearish, or neutral.
2. Read the BREAK RAIL.
Identify where the current structural thesis would begin to fail.
3. Locate the NEAREST support and resistance zones.
These define the next important decision areas.
4. Observe price behavior at those zones.
A rejection, acceptance, or confirmed break is more informative than price merely touching a level.
5. Use PATTERN information as supporting structural context.
A pattern label identifies a qualifying formation. A confirmed BREAK means that the script’s objective boundary condition has also been satisfied.
6. After a confirmed zone break, inspect PT1 and PT2.
These provide the next structural reference points after the breakout or breakdown.
PRACTICAL EXAMPLE
Suppose the dashboard reads:
TREND: BULLISH STRUCTURE
BREAK RAIL: UPTREND BREAK BELOW 76,894
NEAREST: 3D RES 79,461 | D1 SUP 75,568
That does not mean:
“Buy.”
It means:
• The dominant structure remains bullish.
• 76,894 is the current structural failure rail.
• Price is approaching resistance derived from the three-day structure.
• The nearest daily support is 75,568.
• A confirmed resistance break may activate the next PT ladder.
The indicator is therefore providing a map:
Trend → Failure Boundary → Decision Zone → Confirmation → Next Objective
CLEAN MODE VS. RESEARCH MODE
Clean Mode is designed for normal chart use.
It emphasizes the adaptive channel, Break Rail, nearest support and resistance zones, active target ladder, and selective structural events.
Research Mode can additionally display active pattern guide lines for users who want to inspect how structural formations are developing.
ALERTS
KRV Structure includes alert conditions for key structural events, including:
• Uptrend breaks
• Downtrend breaks
• Resistance breaks
• Support breaks
• Bull Flag breaks
• Cup + Handle breaks
• Head & Shoulders breaks
• Ascending Wedge breaks
This allows the chart to remain visually clean while important structural changes can still be monitored.
RECOMMENDED USE
The script is designed primarily for higher-order structure analysis and is best suited to:
Daily / 4H / 1H
Lower timeframes can also be used for tactical timing when appropriate.
The default visual philosophy is intentionally simple:
One primary trend structure.
One failure boundary.
The nearest important levels.
Selective pattern events.
A continuation map when structure breaks.
WHAT KRV STRUCTURE IS NOT
KRV Adaptive Structure Canvas is not intended to predict every reversal, identify guaranteed chart patterns, or generate standalone entry signals.
Its purpose is to make the structural questions surrounding a trade easier to answer:
What is the trend?
Where does it fail?
Where is the next decision zone?
Has the setup actually confirmed?
If price breaks that zone, what comes next?
Less chart clutter. More structural information.
KRV Adaptive Structure Canvas v1.2 is a visual market-structure framework designed to organize trend, structural invalidation, higher-timeframe support and resistance, pattern confirmation, and post-break price objectives on a single chart.
Rather than covering the chart with multiple moving averages, pivots, trendlines, and repeated pattern labels, KRV Structure compresses those functions into one adaptive structural map.
It is not designed as a standalone buy/sell signal system.
Instead, it is built to answer five practical questions:
1. What is the dominant structure?
2. Where does that structure fail?
3. Where is the nearest meaningful support or resistance?
4. Is a recognizable pattern merely forming, or has it actually confirmed?
5. If a key level breaks, what is the next structural objective?
1. ADAPTIVE TREND CHANNEL
The shaded channel represents the current directional structure.
Its basis uses an adaptive KAMA framework, while channel width adjusts using ATR and trend efficiency. In lower-efficiency conditions, the channel expands so ordinary market noise is less likely to trigger unnecessary structural changes.
Green = bullish structure
Red = bearish structure
Neutral = insufficient directional structure
The goal is not to predict every candle.
The goal is to answer a more useful question:
“Is the current trend structure still intact?”
2. BREAK RAIL
The Break Rail is the script’s primary structural invalidation reference.
During bullish structure, the dashboard may display:
UPTREND BREAK BELOW [price]
During bearish structure:
DOWNTREND BREAK ABOVE [price]
This creates an explicit failure boundary for the active trend instead of relying entirely on subjective visual interpretation.
By default, structural breaks require confirmation rather than reacting to a single touch of the rail.
Think of the Break Rail as the level the current structure should not lose if the trend is going to remain intact.
3. MULTI-HORIZON SUPPORT AND RESISTANCE
KRV Structure automatically maps the nearest relevant support and resistance zones using completed higher-timeframe price data.
Potential sources include:
D1 — Previous daily level
2D — Two-day level
3D — Three-day level
W — Weekly level
M — Monthly level
Y — Yearly level
Only the nearest zones are emphasized by default, which keeps the chart focused rather than filling it with distant horizontal levels.
For example:
3D RES 79,461 | D1 SUP 75,568
means the nearest resistance is derived from the three-day structure, while the nearest support comes from the prior daily structure.
These levels are displayed as zones, not as false-precision single-price predictions.
4. STRUCTURAL PATTERN ENGINE
The script also monitors several common structural formations:
• Bull Flag
• Cup + Handle
• Ascending Wedge
• Descending Wedge
• Head & Shoulders
• Inverse Head & Shoulders
The important distinction is that KRV Structure separates pattern candidates from confirmed pattern breaks.
A recognizable shape alone is not enough.
Patterns must persist long enough to satisfy a maturity requirement, and confirmed events require price to break the relevant flag range, handle, wedge boundary, or neckline.
The engine also uses cooldown periods and pattern-instance tracking to reduce repeated signals from effectively the same formation.
The objective is selective structural recognition, not constant pattern labeling.
5. BREAKOUT PRICE-TARGET LADDER
When price confirms a break through the nearest support or resistance zone, the script can activate a projected:
PT1
PT2
ladder.
PT1 prioritizes the next available structural level when one exists. When an appropriate structural level is unavailable, ATR-based extensions provide fallback reference objectives.
This creates a simple progression:
Structure → Decision Zone → Confirmed Break → Next Objective
PT1 and PT2 are reference levels, not guaranteed price forecasts.
READING THE STRUCTURE BADGE
The upper-left badge is designed to summarize the active market structure in a few seconds.
TREND
Displays the current directional structure:
BULLISH STRUCTURE
BEARISH STRUCTURE
BULLISH / BEARISH FORMING
NEUTRAL / RANGE
BREAK RAIL
Displays the current structural failure boundary.
NEAREST
Shows the closest relevant resistance and support zones.
PATTERN
Shows the highest-priority active pattern candidate or confirmed pattern event.
LAST EVENT
Records the most recent significant structural event and its exchange time.
The chart intentionally limits excessive event stamps, so the badge helps preserve important structural information without adding unnecessary visual clutter.
HOW TO USE KRV STRUCTURE
A simple workflow is:
1. Start with TREND.
Determine whether the dominant structure is bullish, bearish, or neutral.
2. Read the BREAK RAIL.
Identify where the current structural thesis would begin to fail.
3. Locate the NEAREST support and resistance zones.
These define the next important decision areas.
4. Observe price behavior at those zones.
A rejection, acceptance, or confirmed break is more informative than price merely touching a level.
5. Use PATTERN information as supporting structural context.
A pattern label identifies a qualifying formation. A confirmed BREAK means that the script’s objective boundary condition has also been satisfied.
6. After a confirmed zone break, inspect PT1 and PT2.
These provide the next structural reference points after the breakout or breakdown.
PRACTICAL EXAMPLE
Suppose the dashboard reads:
TREND: BULLISH STRUCTURE
BREAK RAIL: UPTREND BREAK BELOW 76,894
NEAREST: 3D RES 79,461 | D1 SUP 75,568
That does not mean:
“Buy.”
It means:
• The dominant structure remains bullish.
• 76,894 is the current structural failure rail.
• Price is approaching resistance derived from the three-day structure.
• The nearest daily support is 75,568.
• A confirmed resistance break may activate the next PT ladder.
The indicator is therefore providing a map:
Trend → Failure Boundary → Decision Zone → Confirmation → Next Objective
CLEAN MODE VS. RESEARCH MODE
Clean Mode is designed for normal chart use.
It emphasizes the adaptive channel, Break Rail, nearest support and resistance zones, active target ladder, and selective structural events.
Research Mode can additionally display active pattern guide lines for users who want to inspect how structural formations are developing.
ALERTS
KRV Structure includes alert conditions for key structural events, including:
• Uptrend breaks
• Downtrend breaks
• Resistance breaks
• Support breaks
• Bull Flag breaks
• Cup + Handle breaks
• Head & Shoulders breaks
• Ascending Wedge breaks
This allows the chart to remain visually clean while important structural changes can still be monitored.
RECOMMENDED USE
The script is designed primarily for higher-order structure analysis and is best suited to:
Daily / 4H / 1H
Lower timeframes can also be used for tactical timing when appropriate.
The default visual philosophy is intentionally simple:
One primary trend structure.
One failure boundary.
The nearest important levels.
Selective pattern events.
A continuation map when structure breaks.
WHAT KRV STRUCTURE IS NOT
KRV Adaptive Structure Canvas is not intended to predict every reversal, identify guaranteed chart patterns, or generate standalone entry signals.
Its purpose is to make the structural questions surrounding a trade easier to answer:
What is the trend?
Where does it fail?
Where is the next decision zone?
Has the setup actually confirmed?
If price breaks that zone, what comes next?
Less chart clutter. More structural information.
オープンソーススクリプト
TradingViewの精神に則り、このスクリプトの作者はコードをオープンソースとして公開してくれました。トレーダーが内容を確認・検証できるようにという配慮です。作者に拍手を送りましょう!無料で利用できますが、コードの再公開はハウスルールに従う必要があります。

免責事項
これらの情報および投稿は、TradingViewが提供または承認する金融、投資、取引、またはその他の種類の助言もしくは推奨であることを意図したものではなく、またこれらに該当するものでもありません。詳細は利用規約をご覧ください。
オープンソーススクリプト
TradingViewの精神に則り、このスクリプトの作者はコードをオープンソースとして公開してくれました。トレーダーが内容を確認・検証できるようにという配慮です。作者に拍手を送りましょう!無料で利用できますが、コードの再公開はハウスルールに従う必要があります。
免責事項
これらの情報および投稿は、TradingViewが提供または承認する金融、投資、取引、またはその他の種類の助言もしくは推奨であることを意図したものではなく、またこれらに該当するものでもありません。詳細は利用規約をご覧ください。