アップデート済
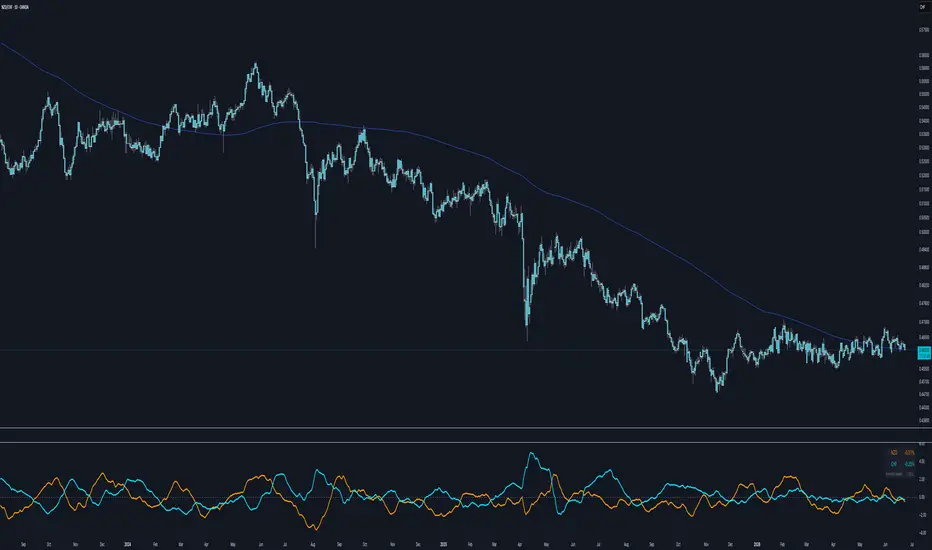
Active Pair Currency Strength
¡Uff, sí! Se hizo un "licuado" total de texto al pegar. Eso pasa porque el editor de TradingView a veces ignora los saltos de línea simples si vienen muy juntos y no soporta ecuaciones complejas en LaTeX (así que los símbolos como \frac y \text se ven rarísimos en la pantalla).
Aquí tienes la versión completamente limpia, estructurada con títulos claros, viñetas y matemáticas en texto plano legible para que cuando lo pegues se vea impecable, ordenado y muy profesional.
Asegúrate de dejar un espacio en blanco (un doble Enter) entre cada párrafo al pegarlo si ves que el editor de TradingView intenta juntarlos de nuevo.
📝 Copia y pega el siguiente bloque de texto en inglés:
📊 What is "Active Pair Currency Strength"?
This indicator is a professional-grade relative strength oscillator designed to identify true market divergences and trend reversals in Forex pairs.
Unlike traditional currency strength meters that isolate only the two components of your current chart—causing massive USD volatility to distort the lines—this script calculates a global 8-currency matrix in the background.
To keep your workspace 100% clean and focused on your trading execution, it visually renders only the two lines corresponding to your active chart's pair. Inspired by advanced macro analysis dashboards like MarketMilk (Babypips), this indicator strips away the overwhelming USD background noise and dynamically auto-adjusts the Y-axis scale so micro-divergences become instantly scannable.
🧮 How the Math Works (Why it’s a game-changer)
To completely eliminate USD-dominance bias, the script runs a global basket normalization algorithm on every single bar:
Simultaneous Multi-Asset Fetching: No matter which pair you are actively viewing, the script requests backend data for the 7 major currencies against the USD (EURUSD, GBPUSD, AUDUSD, NZDUSD, USDCAD, USDCHF, USDJPY).
Raw Return Calculation: It measures the percentage return of each currency based on your selected lookback window (22-bar rolling window by default, representing 30 calendar days of trading). The raw return of the USD itself is strictly benchmarked at 0.0.
Global Average Normalization: The script calculates the arithmetic mean of the entire currency market:
Global Average = (Sum of all 8 currency returns) / 8
Extracting True Strength: It subtracts this Global Average from each individual currency's raw return:
True Strength = Raw Return - Global Average
By removing the overall market's average drift, the USD stops being a flat line at zero and fluctuates dynamically. More importantly, the indicator's Y-axis contracts dramatically (auto-zooming in). This amplifies the micro-divergences between your chart's two currencies, forcing them into an elegant "mirror effect" around the zero line.
5. Exclusive Display Filtering: It detects the base and quote currencies of your active chart and instantly hides the other 6 currencies, leaving you with a laser-focused, distraction-free panel.
🛠️ Key Features & Inputs
Data Source Selector: Easily toggle between Spot Forex (utilizing dynamic broker feeds) and CME Futures (Pro) (utilizing institutional, high-liquidity continuous futures contracts like 6E1!, 6B1!, 6J1!, etc.).
Flexible Anchor Modes:
Rolling Period: A continuous lookback window of N bars (Set to 22 or 30 to track the classic "last 30 days" look).
Weekly Anchor: Every line resets strictly to 0.0 at Monday's market open, allowing you to track intra-week capital flows.
EMA Smoothing Filter: An optional moving average layer to shave off erratic price noise and algorithmic spikes, converting raw data into highly readable, organic curves without introducing critical execution lag.
📈 How to Trade with this Tool (Visual Strategy)
Trend Confirmation (The Mirror Effect): A healthy, strong trend is confirmed when the Base and Quote lines expand symmetrically in completely opposite directions away from the zero equilibrium line.
Line Crossover (Early Reversal Trigger): When the Base currency line crosses over the Quote currency line at overextended historical extremes, it serves as a high-probability warning of an impending structural shift on the main price chart.
Divergence Exhaustion: When the vertical distance between the two lines becomes unsustainably wide, the market "rubber band" is stretched to its limit. This is your cue to look for price action reversal triggers, as a retracement or consolidation is highly imminent.
Aquí tienes la versión completamente limpia, estructurada con títulos claros, viñetas y matemáticas en texto plano legible para que cuando lo pegues se vea impecable, ordenado y muy profesional.
Asegúrate de dejar un espacio en blanco (un doble Enter) entre cada párrafo al pegarlo si ves que el editor de TradingView intenta juntarlos de nuevo.
📝 Copia y pega el siguiente bloque de texto en inglés:
📊 What is "Active Pair Currency Strength"?
This indicator is a professional-grade relative strength oscillator designed to identify true market divergences and trend reversals in Forex pairs.
Unlike traditional currency strength meters that isolate only the two components of your current chart—causing massive USD volatility to distort the lines—this script calculates a global 8-currency matrix in the background.
To keep your workspace 100% clean and focused on your trading execution, it visually renders only the two lines corresponding to your active chart's pair. Inspired by advanced macro analysis dashboards like MarketMilk (Babypips), this indicator strips away the overwhelming USD background noise and dynamically auto-adjusts the Y-axis scale so micro-divergences become instantly scannable.
🧮 How the Math Works (Why it’s a game-changer)
To completely eliminate USD-dominance bias, the script runs a global basket normalization algorithm on every single bar:
Simultaneous Multi-Asset Fetching: No matter which pair you are actively viewing, the script requests backend data for the 7 major currencies against the USD (EURUSD, GBPUSD, AUDUSD, NZDUSD, USDCAD, USDCHF, USDJPY).
Raw Return Calculation: It measures the percentage return of each currency based on your selected lookback window (22-bar rolling window by default, representing 30 calendar days of trading). The raw return of the USD itself is strictly benchmarked at 0.0.
Global Average Normalization: The script calculates the arithmetic mean of the entire currency market:
Global Average = (Sum of all 8 currency returns) / 8
Extracting True Strength: It subtracts this Global Average from each individual currency's raw return:
True Strength = Raw Return - Global Average
By removing the overall market's average drift, the USD stops being a flat line at zero and fluctuates dynamically. More importantly, the indicator's Y-axis contracts dramatically (auto-zooming in). This amplifies the micro-divergences between your chart's two currencies, forcing them into an elegant "mirror effect" around the zero line.
5. Exclusive Display Filtering: It detects the base and quote currencies of your active chart and instantly hides the other 6 currencies, leaving you with a laser-focused, distraction-free panel.
🛠️ Key Features & Inputs
Data Source Selector: Easily toggle between Spot Forex (utilizing dynamic broker feeds) and CME Futures (Pro) (utilizing institutional, high-liquidity continuous futures contracts like 6E1!, 6B1!, 6J1!, etc.).
Flexible Anchor Modes:
Rolling Period: A continuous lookback window of N bars (Set to 22 or 30 to track the classic "last 30 days" look).
Weekly Anchor: Every line resets strictly to 0.0 at Monday's market open, allowing you to track intra-week capital flows.
EMA Smoothing Filter: An optional moving average layer to shave off erratic price noise and algorithmic spikes, converting raw data into highly readable, organic curves without introducing critical execution lag.
📈 How to Trade with this Tool (Visual Strategy)
Trend Confirmation (The Mirror Effect): A healthy, strong trend is confirmed when the Base and Quote lines expand symmetrically in completely opposite directions away from the zero equilibrium line.
Line Crossover (Early Reversal Trigger): When the Base currency line crosses over the Quote currency line at overextended historical extremes, it serves as a high-probability warning of an impending structural shift on the main price chart.
Divergence Exhaustion: When the vertical distance between the two lines becomes unsustainably wide, the market "rubber band" is stretched to its limit. This is your cue to look for price action reversal triggers, as a retracement or consolidation is highly imminent.
リリースノート
feat(mtf): implement custom state-persistent EMA engine for perfect multi-timeframe synchronizationRefactored the historical data architecture and smoothing layers to ensure 100% mathematical consistency across all chart resolutions.
- fix(anchor): move the `close[lookback]` logic directly into `request.security` calls to guarantee daily timeframe anchoring regardless of the local chart timeframe.
- feat(smooth): replace native `ta.ema()` with a custom `smoothMTF()` algorithm that only samples data on actual daily session closes, eliminating intraday calculation drift.
- refactor(data): introduce `getPair()` tuple function to optimize multi-timeframe request structures and clean up backend code.
- performance: reduce visual "staircase" line artifacts on intraday charts (4H, 1H) by implementing real-time continuous projections.
SemVer: minor (backward-compatible feature addition and refactoring)
Bumps version from 1.0.0 to 1.1.0
リリースノート
feat(alerts): integrate dynamic multi-condition alerts with optimized state trackingIntroduced a robust, single-channel alert system utilizing the native alert() function in Pine Script v6, engineered to prevent state corruption on lower timeframes.
- feat(crossover): add dynamic bullish/bearish crossover alerts based on smoothed MTF lines.
- feat(overextension): implement a maximum distance threshold alert to flag potential divergence exhaustion.
- fix(state): refactor `ta.crossover` and `ta.crossunder` executions to run globally on every bar, preventing state-variable corruption within conditional branches.
- performance: embed `barstate.isconfirmed` guards to eliminate intraday alert repainting and message spamming.
SemVer: minor (backward-compatible feature addition and state-tracking optimization)
Bumps version from 1.1.0 to 1.2.0

免責事項
これらの情報および投稿は、TradingViewが提供または承認する金融、投資、取引、またはその他の種類の助言もしくは推奨であることを意図したものではなく、またこれらに該当するものでもありません。詳細は利用規約をご覧ください。
免責事項
これらの情報および投稿は、TradingViewが提供または承認する金融、投資、取引、またはその他の種類の助言もしくは推奨であることを意図したものではなく、またこれらに該当するものでもありません。詳細は利用規約をご覧ください。