アップデート済
Weekly Change(Green&Red) & Percentage Change(Blue&Yellow)
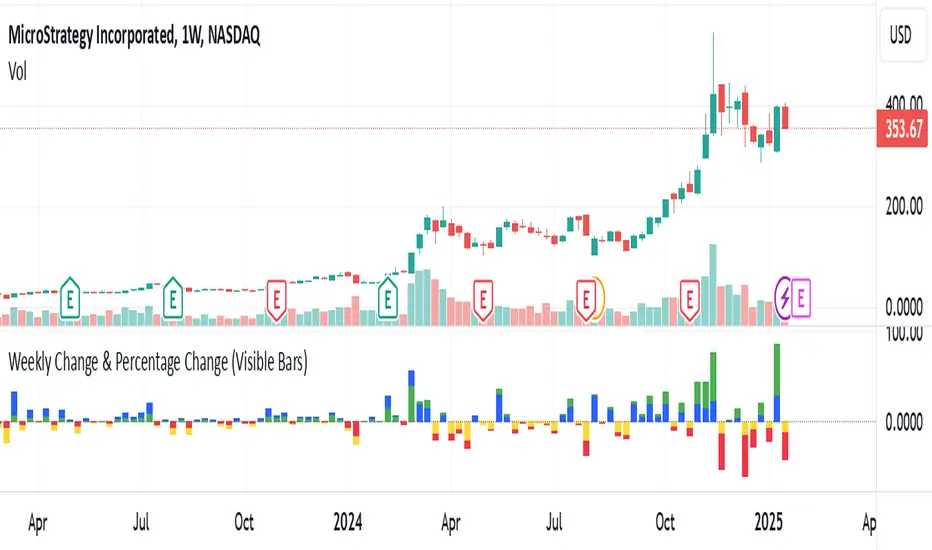
Display bar chart of weekly price action. Use to determine the maximum price change in one week. It would be the possible strike price for a covered call option for weekly income.
リリースノート
Bar chart of weekly price action. Display in percentage and absolute values. Use to determine historical maximum price change weekly, possible strike price for covered call option to create weekly income.
免責事項
これらの情報および投稿は、TradingViewが提供または承認する金融、投資、取引、またはその他の種類の助言もしくは推奨であることを意図したものではなく、またこれらに該当するものでもありません。詳細は利用規約をご覧ください。
免責事項
これらの情報および投稿は、TradingViewが提供または承認する金融、投資、取引、またはその他の種類の助言もしくは推奨であることを意図したものではなく、またこれらに該当するものでもありません。詳細は利用規約をご覧ください。