INVITE-ONLY SCRIPT
アップデート済 MarketProfile HL
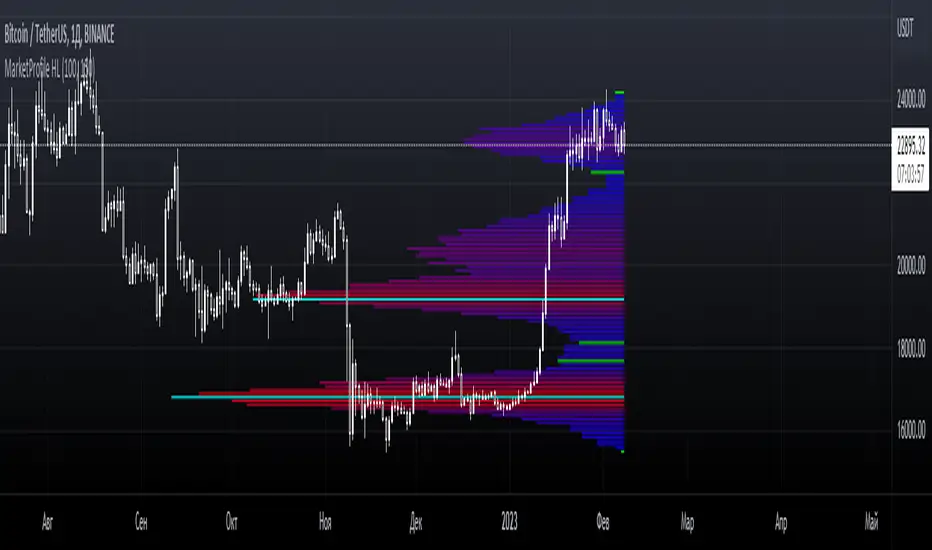
MarketProfile HL dynamically calculates and displays a side histogram of the distribution of volumes with colors along a gradient, which is set to a given number of candles. The histogram is overlaid on the candlesticks to visually represent areas of market balance and imbalance. The indicator uses the concepts of statistical distribution and is based on the market profile theory.
The gradient color of the levels shows where more or less horizontal volume accumulates.
Adapts to any timeframe or instrument.
Customizable display of horizontal levels HL and POC.
The HL and POC levels protrude beyond the boundaries of the main histogram on the right for a more convenient determination of dynamic centers and accumulation boundaries.
-------------------------------------------
MarketProfile HL динамически рассчитывает и отображает боковую гистограмму распределения объемов с цветами по градиенту, которая настроена на заданное количество свечей. Гистограмма накладывается на свечи, чтобы визуально представить области рыночного баланса и дисбаланса. Индикатор использует концепции статистического распределения и основан на теории профиля рынка.
Градиентный цвет уровней показывает, где накапливается больше или меньше горизонтального объема.
Адаптируется к любому таймфрейму или инструменту.
Настраиваемое отображение горизонтальных уровней HL и POC.
Уровни HL и POC выступают за границы основной гистограммы справа для более удобного определения динамических центров и границ накоплений.
The gradient color of the levels shows where more or less horizontal volume accumulates.
Adapts to any timeframe or instrument.
Customizable display of horizontal levels HL and POC.
The HL and POC levels protrude beyond the boundaries of the main histogram on the right for a more convenient determination of dynamic centers and accumulation boundaries.
-------------------------------------------
MarketProfile HL динамически рассчитывает и отображает боковую гистограмму распределения объемов с цветами по градиенту, которая настроена на заданное количество свечей. Гистограмма накладывается на свечи, чтобы визуально представить области рыночного баланса и дисбаланса. Индикатор использует концепции статистического распределения и основан на теории профиля рынка.
Градиентный цвет уровней показывает, где накапливается больше или меньше горизонтального объема.
Адаптируется к любому таймфрейму или инструменту.
Настраиваемое отображение горизонтальных уровней HL и POC.
Уровни HL и POC выступают за границы основной гистограммы справа для более удобного определения динамических центров и границ накоплений.
リリースノート
Total revision of the script with new calcualtion logic and optimization. Colors are fixed and updated for the correct gradient. POC and HL levels show the correct length and correspond to the actual accumulations. Settings are simplified for faster configuration.
-------------------------------------------
Полное обновление индикатора с новой логикой расчета и оптимизацией. Цвета фиксированы и обновляются для правильного градиента. Уровни POC и HL показывают правильную длину и соответствуют фактическим накоплениям.
Настройки упрощены для более быстрой навигации.
リリースノート
The script has been completely updated to the latest v6 of Pine Script. This has improved the indicator's stability, reduced the likelihood of errors when loading and recalculating data, and significantly improved rendering speed, especially on charts with a large number of bars.The color display system was redesigned. Flexible customization is now available. You can customize the histogram gradient, including color transitions, as well as separately set the color of the central accumulation zone and its edges. This allows the visual component of the indicator to be tailored to personal preferences, the chart theme, and the analysis tasks, and also makes the accumulation structure more visually clear.
A histogram Shift parameter has been added. This allows the histogram to be moved away from the candlesticks, simplifying visual analysis and reducing overlapping elements on the chart. The histogram can be effectively locked to the right edge if the chart remains stationary, which is especially convenient for detailed analysis of the current situation without scrolling.
招待専用スクリプト
このスクリプトは作者が承認したユーザーのみアクセス可能です。使用するにはアクセス申請をして許可を得る必要があります。通常は支払い後に承認されます。詳細は下記の作者の指示に従うか、CryptoLevelsに直接お問い合わせください。
TradingViewは、作者を完全に信頼し、スクリプトの動作を理解していない限り、有料スクリプトの購入・使用を推奨しません。コミュニティスクリプトには無料のオープンソースの代替が多数あります。
作者の指示
Please contact in PM to request access.
Пожалуйста, пишите в личные сообщения, чтобы запросить доступ.

🎁 7 дней бесплатно: t.me/CryptoLevels_paybot
📅 Ежедневный анализ: t.me/cryptolevels_ru
📅 Ежедневный анализ: t.me/cryptolevels_ru
免責事項
これらの情報および投稿は、TradingViewが提供または承認する金融、投資、取引、またはその他の種類の助言もしくは推奨であることを意図したものではなく、またこれらに該当するものでもありません。詳細は利用規約をご覧ください。
招待専用スクリプト
このスクリプトは作者が承認したユーザーのみアクセス可能です。使用するにはアクセス申請をして許可を得る必要があります。通常は支払い後に承認されます。詳細は下記の作者の指示に従うか、CryptoLevelsに直接お問い合わせください。
TradingViewは、作者を完全に信頼し、スクリプトの動作を理解していない限り、有料スクリプトの購入・使用を推奨しません。コミュニティスクリプトには無料のオープンソースの代替が多数あります。
作者の指示
Please contact in PM to request access.
Пожалуйста, пишите в личные сообщения, чтобы запросить доступ.
🎁 7 дней бесплатно: t.me/CryptoLevels_paybot
📅 Ежедневный анализ: t.me/cryptolevels_ru
📅 Ежедневный анализ: t.me/cryptolevels_ru
免責事項
これらの情報および投稿は、TradingViewが提供または承認する金融、投資、取引、またはその他の種類の助言もしくは推奨であることを意図したものではなく、またこれらに該当するものでもありません。詳細は利用規約をご覧ください。