OPEN-SOURCE SCRIPT
更新済 Sphinx DOL & Gamma Confluence
Sphinx DOL & Gamma Confluence
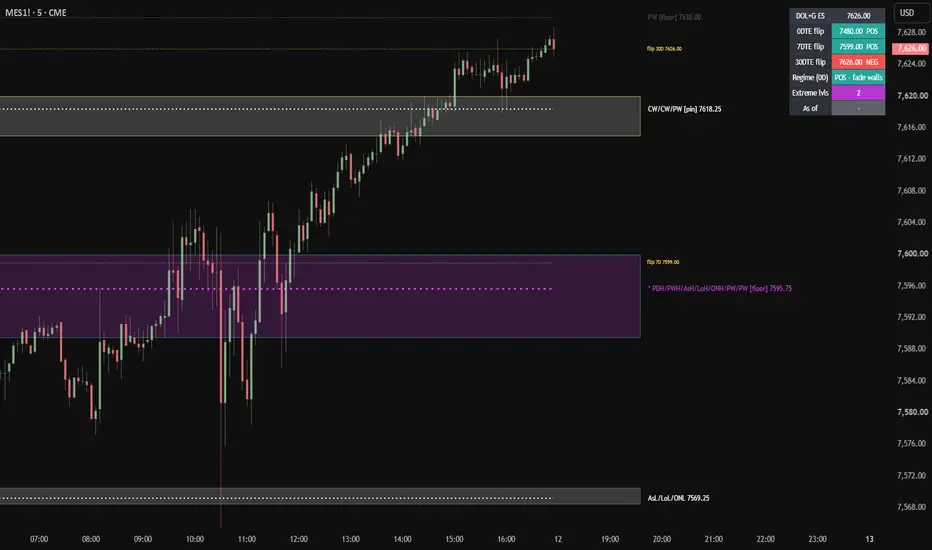
A positioning map that clusters draw-on-liquidity (DOL) levels together with options gamma levels, then grades each zone by how much confluence sits there - so the levels that matter stand out from the noise.
DOL LEVELS (computed automatically from price)
Prior day, week, and month high/low (PDH/PDL, PWH/PWL, PMH/PML); prior Asia and London session high/low; and overnight high/low (18:00-09:30, frozen at the RTH open). Each is tracked as tested or still naked (untested), and untested levels are weighted higher as live magnets. All toggleable.
GAMMA LEVELS (optional, entered by the user)
Gamma levels are price levels derived from options positioning that tend to act as support/resistance because of how dealers hedge:
- Call wall (CW): a strike with heavy call interest, usually above price - dealer hedging tends to lean against rallies there, so it often acts as a ceiling (red border).
- Put wall (PW): a strike with heavy put interest, usually below price - hedging tends to support dips there, so it often acts as a floor (green border).
- Flip (zero-gamma): the regime divider. Above it (positive gamma), hedging dampens moves - price tends to pin and walls tend to hold (fade environment). Below it (negative gamma), hedging amplifies moves - price tends to trend and walls tend to break into targets (trend environment).
Enter these per expiry (0/7/30 DTE) either as individual fields or as a pasted string; the tool auto-detects the chart symbol (ES/NQ/RTY/GC and micros).
HOW ZONES RENDER
Nearby levels merge into one translucent band. Fill color = confluence strength: extreme (a gamma wall stacked on a DOL level), major, or minor. Border color = direction: red ceiling, green floor, yellow pin (both), gray for pure liquidity. Labels list the members and tag [ceiling]/[floor]/[pin], with (naked) on untested levels. A table shows price, the 0/7/30 DTE flips with a positive/negative gamma read, the current regime, an extreme-zone count, and a snapshot-time stamp you set.
The value is combining two different mechanisms: DOL shows where liquidity rests (reactive), gamma shows where hedging flow will occur (anticipatory) - where they align is the highest-conviction zone.
IMPORTANT - DATA SOURCE
This tool does not source, provide, or connect to any options/gamma data. Gamma levels are entered manually by each user from whatever external source they choose, and their accuracy is entirely the user's responsibility. DOL levels work with no gamma input at all. Gamma tendencies are probabilistic, not guarantees - walls hold more often in positive gamma but can break.
This is a context/mapping tool, not a signal generator: no entries, no alerts, no automation. For educational purposes only; nothing here is financial advice. Verify all levels against your own sources.
A positioning map that clusters draw-on-liquidity (DOL) levels together with options gamma levels, then grades each zone by how much confluence sits there - so the levels that matter stand out from the noise.
DOL LEVELS (computed automatically from price)
Prior day, week, and month high/low (PDH/PDL, PWH/PWL, PMH/PML); prior Asia and London session high/low; and overnight high/low (18:00-09:30, frozen at the RTH open). Each is tracked as tested or still naked (untested), and untested levels are weighted higher as live magnets. All toggleable.
GAMMA LEVELS (optional, entered by the user)
Gamma levels are price levels derived from options positioning that tend to act as support/resistance because of how dealers hedge:
- Call wall (CW): a strike with heavy call interest, usually above price - dealer hedging tends to lean against rallies there, so it often acts as a ceiling (red border).
- Put wall (PW): a strike with heavy put interest, usually below price - hedging tends to support dips there, so it often acts as a floor (green border).
- Flip (zero-gamma): the regime divider. Above it (positive gamma), hedging dampens moves - price tends to pin and walls tend to hold (fade environment). Below it (negative gamma), hedging amplifies moves - price tends to trend and walls tend to break into targets (trend environment).
Enter these per expiry (0/7/30 DTE) either as individual fields or as a pasted string; the tool auto-detects the chart symbol (ES/NQ/RTY/GC and micros).
HOW ZONES RENDER
Nearby levels merge into one translucent band. Fill color = confluence strength: extreme (a gamma wall stacked on a DOL level), major, or minor. Border color = direction: red ceiling, green floor, yellow pin (both), gray for pure liquidity. Labels list the members and tag [ceiling]/[floor]/[pin], with (naked) on untested levels. A table shows price, the 0/7/30 DTE flips with a positive/negative gamma read, the current regime, an extreme-zone count, and a snapshot-time stamp you set.
The value is combining two different mechanisms: DOL shows where liquidity rests (reactive), gamma shows where hedging flow will occur (anticipatory) - where they align is the highest-conviction zone.
IMPORTANT - DATA SOURCE
This tool does not source, provide, or connect to any options/gamma data. Gamma levels are entered manually by each user from whatever external source they choose, and their accuracy is entirely the user's responsibility. DOL levels work with no gamma input at all. Gamma tendencies are probabilistic, not guarantees - walls hold more often in positive gamma but can break.
This is a context/mapping tool, not a signal generator: no entries, no alerts, no automation. For educational purposes only; nothing here is financial advice. Verify all levels against your own sources.
リリースノート
Update title リリースノート
Add 0830 & midnight opening lines. リリースノート
Update - Opening EQ lines + manual inputNew:
- Opening EQ reference lines with individual toggles: Midnight (Daily EQ),
08:30 (NY Open EQ), 09:30 (RTH Open), plus optional Weekly and Monthly opens.
Drawn separately from the confluence clusters, since opens act as equilibrium
pivots rather than liquidity magnets. Each has its own color.
- Gamma input now has three modes (Gamma source dropdown): paste a full string,
enter levels manually in number fields (per 0/7/30 DTE), or load a built-in demo.
Manual fields build the same string the parser uses, so all modes behave identically.
Improved:
- 08:30 / 09:30 open capture now uses a minute-cross instead of an exact-bar match,
so the lines draw reliably across intraday timeframes.
Notes:
- DOL levels compute automatically from price and work with no gamma input.
- Gamma levels are optional and entered by the user from their own source.
- Context/mapping tool only - no entries, no alerts, no automation.
- Educational purposes only, not financial advice.
リリースノート
v2.0 - Floor/ceiling strength weightingFloor and ceiling levels are now graded by how many walls stack at them, rather than only flagging that a wall is present.
- Dominance-based tags: a cluster with more put walls than call walls reads [floor]; more calls than puts reads [ceiling]. A single minor opposing wall no longer demotes a strong shelf to [pin] - [pin] is now reserved for clusters with an equal number of put and call walls.
- Strength grading by wall count: [floor] = one wall, [floor+] = two, [floor++] = three or more (same scale for ceilings). Stronger shelves also draw a bolder, more opaque zone border, so a lone single-wall level is easy to distinguish at a glance from a genuine multi-wall shelf.
Everything else - DOL clustering, naked-level weighting, flip lines, opening EQ lines, and the regime table - is unchanged.
リリースノート
Update: strength-weighted floor/ceiling + per-level controlsFLOOR / CEILING STRENGTH
Floor and ceiling levels are now graded by how many walls stack at them, instead of only flagging that a wall is present.
- Dominance-based tags: more put walls than call walls reads [floor]; more calls than puts reads [ceiling]. A single minor opposing wall no longer demotes a strong shelf to [pin] - [pin] is reserved for clusters with an equal number of put and call walls.
- Strength grading by wall count: [floor] = one wall, [floor+] = two, [floor++] = three or more (same scale for ceilings). Stronger shelves draw a bolder, more opaque zone border.
NEW DISPLAY CONTROLS
- Show zone bands (Style): turn the filled bands off entirely, leaving only the graded lines and labels. Off also frees box budget.
- Per-level DOL toggles: previous day H/L, previous week H/L, Asia session H/L and London session H/L each have their own on/off switch, alongside the existing previous month and overnight toggles. Every DOL level type is now individually controllable.
Clustering, flip lines, opening EQ lines and the regime table are unchanged.
リリースノート
Update: HTF FVG confluenceAdded an optional layer that draws a higher-timeframe fair value gap only when a floor or ceiling cluster sits inside it - so the gap is surfaced because a gamma level is confluent with it, not on its own.
- Detects the most recent 1H and 4H fair value gap on each side (bullish and bearish) from confirmed higher-timeframe bars.
- A gap is drawn only when a floor or ceiling cluster's price falls inside it. It is colored by the gap's own direction: green for a bullish gap, red for a bearish gap, regardless of whether the wall agrees.
- 1H is preferred: if both a 1H and a 4H gap qualify on the same side, only the 1H one is drawn. At most one bullish and one bearish gap show at a time.
- Freshness: a stored gap is replaced when a newer same-type gap forms, and it is dropped once price closes through it (bullish gap on a close below its bottom, bearish gap on a close above its top). Only fresh, unmitigated gaps are eligible to draw.
New "HTF FVG" input group: master toggle, 1H / 4H toggles, bull and bear colors, and opacity.
Clustering, floor/ceiling strength weighting, per-level DOL toggles, zone-band toggle, flip lines, opening EQ lines and the regime table are unchanged.
リリースノート
Fix: resolved a runtime error that could occur when drawing the HTF FVG zones on some charts. No change to behavior or inputs.オープンソーススクリプト
TradingViewの精神に則り、このスクリプトの作者はコードをオープンソースとして公開してくれました。トレーダーが内容を確認・検証できるようにという配慮です。作者に拍手を送りましょう!無料で利用できますが、コードの再公開はハウスルールに従う必要があります。

免責事項
これらの情報および投稿は、TradingViewが提供または承認する金融、投資、取引、またはその他の種類の助言もしくは推奨であることを意図したものではなく、またこれらに該当するものでもありません。詳細は利用規約をご覧ください。
オープンソーススクリプト
TradingViewの精神に則り、このスクリプトの作者はコードをオープンソースとして公開してくれました。トレーダーが内容を確認・検証できるようにという配慮です。作者に拍手を送りましょう!無料で利用できますが、コードの再公開はハウスルールに従う必要があります。
免責事項
これらの情報および投稿は、TradingViewが提供または承認する金融、投資、取引、またはその他の種類の助言もしくは推奨であることを意図したものではなく、またこれらに該当するものでもありません。詳細は利用規約をご覧ください。