OPEN-SOURCE SCRIPT
Advanced Support & Resistance - Volume Zones
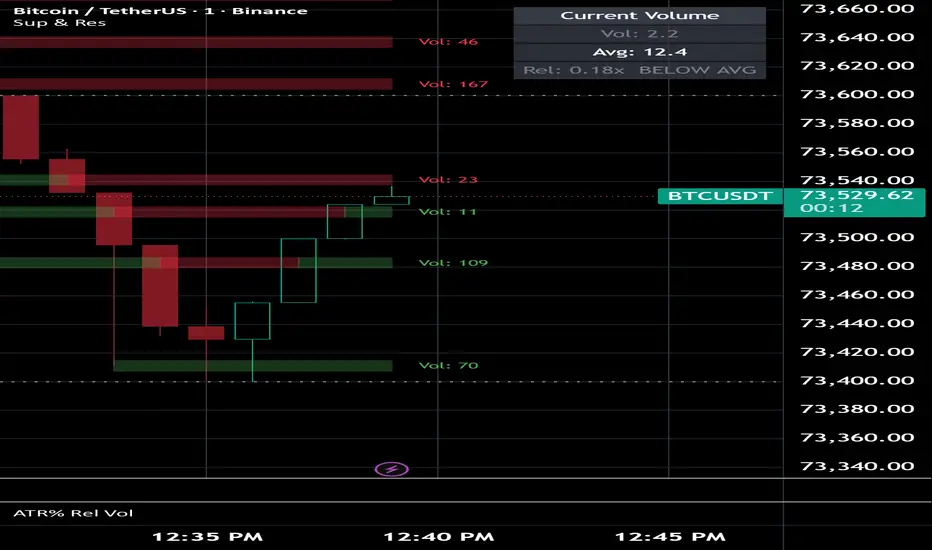
**Advanced Support & Resistance - Volume Zones**
This indicator identifies potential support and resistance areas by detecting high-volume pivot points and converting them into visual price zones. Zones are created when unusual volume appears near local highs or lows, helping highlight areas where buying or selling pressure may have previously been significant.
The script includes automatic zone tuning that adjusts volume sensitivity, merge range, zone age, and visual zone thickness based on current market conditions and chart timeframe. This helps keep the zones proportional across very small timeframes, such as 1-second charts, as well as larger timeframes, including daily charts.
Key features include:
* High-volume support and resistance zone detection
* Automatic zone-setting adjustment based on market activity
* Automatic zone-appearance scaling by chart timeframe
* Optional volume-based zone widths
* Zone role reversal when price breaks through support or resistance
* Optional price-action swing lines for important pivot highs and lows that do not already have nearby volume zones
* Current bar volume status table showing volume, average volume, relative volume, and volume condition
* Customizable zone colors, opacity, borders, label size, and swing-line appearance
This script is designed to provide a cleaner view of meaningful support and resistance areas by combining volume activity with price structure. It can be useful for identifying possible reaction zones, breakout areas, retest levels, and areas of market interest.
As always, this indicator is intended as a visual analysis tool and should be used alongside your own trading plan, risk management, and confirmation methods.
Refinement assistance: Blue Finch
This indicator identifies potential support and resistance areas by detecting high-volume pivot points and converting them into visual price zones. Zones are created when unusual volume appears near local highs or lows, helping highlight areas where buying or selling pressure may have previously been significant.
The script includes automatic zone tuning that adjusts volume sensitivity, merge range, zone age, and visual zone thickness based on current market conditions and chart timeframe. This helps keep the zones proportional across very small timeframes, such as 1-second charts, as well as larger timeframes, including daily charts.
Key features include:
* High-volume support and resistance zone detection
* Automatic zone-setting adjustment based on market activity
* Automatic zone-appearance scaling by chart timeframe
* Optional volume-based zone widths
* Zone role reversal when price breaks through support or resistance
* Optional price-action swing lines for important pivot highs and lows that do not already have nearby volume zones
* Current bar volume status table showing volume, average volume, relative volume, and volume condition
* Customizable zone colors, opacity, borders, label size, and swing-line appearance
This script is designed to provide a cleaner view of meaningful support and resistance areas by combining volume activity with price structure. It can be useful for identifying possible reaction zones, breakout areas, retest levels, and areas of market interest.
As always, this indicator is intended as a visual analysis tool and should be used alongside your own trading plan, risk management, and confirmation methods.
Refinement assistance: Blue Finch
オープンソーススクリプト
TradingViewの精神に則り、このスクリプトの作者はコードをオープンソースとして公開してくれました。トレーダーが内容を確認・検証できるようにという配慮です。作者に拍手を送りましょう!無料で利用できますが、コードの再公開はハウスルールに従う必要があります。

免責事項
これらの情報および投稿は、TradingViewが提供または承認する金融、投資、取引、またはその他の種類の助言もしくは推奨であることを意図したものではなく、またこれらに該当するものでもありません。詳細は利用規約をご覧ください。
オープンソーススクリプト
TradingViewの精神に則り、このスクリプトの作者はコードをオープンソースとして公開してくれました。トレーダーが内容を確認・検証できるようにという配慮です。作者に拍手を送りましょう!無料で利用できますが、コードの再公開はハウスルールに従う必要があります。
免責事項
これらの情報および投稿は、TradingViewが提供または承認する金融、投資、取引、またはその他の種類の助言もしくは推奨であることを意図したものではなく、またこれらに該当するものでもありません。詳細は利用規約をご覧ください。