OPEN-SOURCE SCRIPT
アップデート済 Cumulative New Highs - New Lows
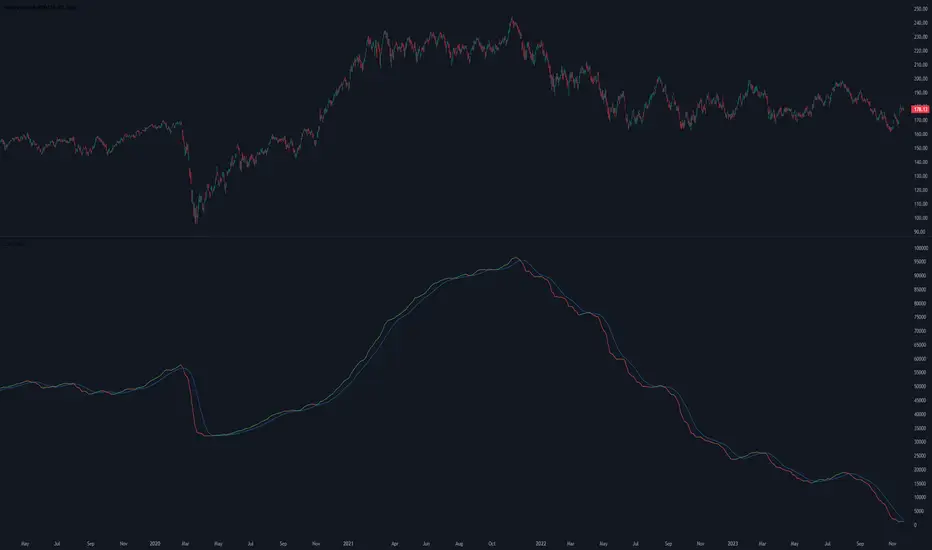
Indicator that plots the cumulative number of 52-Week New Highs minus New Lows with an added moving average. Settings allow the choice between S&P 500, Nasdaq 100 or the Overall Market as Index. You can also customize the length of the moving average.
リリースノート
Indicator now opens in a new pane by default.リリースノート
Added Nasdaq Composite, NYSE Composite and Russel 2000 as available indices.リリースノート
Minor changesリリースノート
NYSE, Nasdaq Composite and Total Stock Market now feature historical data until 2005.リリースノート
minor changesリリースノート
Updated termsリリースノート
Corrected typoリリースノート
Index clarification and minor optical changesオープンソーススクリプト
TradingViewの精神に則り、このスクリプトの作者はコードをオープンソースとして公開してくれました。トレーダーが内容を確認・検証できるようにという配慮です。作者に拍手を送りましょう!無料で利用できますが、コードの再公開はハウスルールに従う必要があります。

免責事項
これらの情報および投稿は、TradingViewが提供または承認する金融、投資、取引、またはその他の種類の助言もしくは推奨であることを意図したものではなく、またこれらに該当するものでもありません。詳細は利用規約をご覧ください。
オープンソーススクリプト
TradingViewの精神に則り、このスクリプトの作者はコードをオープンソースとして公開してくれました。トレーダーが内容を確認・検証できるようにという配慮です。作者に拍手を送りましょう!無料で利用できますが、コードの再公開はハウスルールに従う必要があります。
免責事項
これらの情報および投稿は、TradingViewが提供または承認する金融、投資、取引、またはその他の種類の助言もしくは推奨であることを意図したものではなく、またこれらに該当するものでもありません。詳細は利用規約をご覧ください。