Day Trade Setup - Multi Timeframe Candles
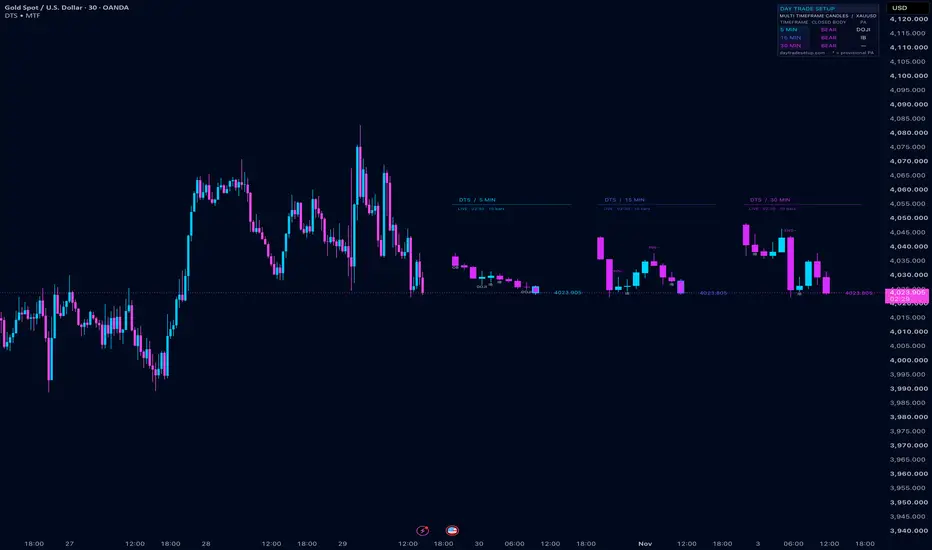
Multi Timeframe Candles displays recent candles from up to three independently selected timeframes beside the current chart. It combines candle structure, optional price-action labels, latest prices, candle countdowns, and a summary of the latest available closed candle for each timeframe.
The purpose is to compare the same symbol across timeframes without repeatedly changing the main chart interval. This is a visual analysis indicator, not a trading strategy or an automated entry and exit system.
How the display works
Each panel retrieves open, high, low, and close data from its selected timeframe. Candles are arranged from oldest on the left to newest on the right. The default configuration shows 10 candles for each of the 5-minute, 15-minute, and 30-minute timeframes. Each panel can be enabled, disabled, or assigned a different timeframe, with 3 to 30 candles per panel.
Panel timeframes may be lower than, equal to, or higher than the chart timeframe, subject to TradingView data availability. History is retrieved within each selected timeframe, rather than constructed by repeating or indexing values on the main chart interval.
Candles retain their actual OHLC prices on the chart's price scale. Their horizontal positions are display positions, not their original timestamps and not future price projections. A panel placed to the right of the latest chart bar does not represent a forecast.
Why these features are combined
The implementation connects three parts of the same review process: recent candle structure, the pattern classification of individual candles, and a compact closed-candle summary. This lets users inspect a pattern in the candle panel while checking the corresponding timeframe's latest closed body direction separately. The summary deliberately distinguishes body direction from pattern bias; for example, an upward-closing candle can meet the bearish Pin Bar conditions.
The candlestick patterns themselves are established concepts. The contribution is the configurable multi-timeframe presentation, the shared price scale, and the separation between developing candles and the closed-candle summary. No new predictive properties are claimed for these patterns.
Panel headers and visual controls
Each panel has a transparent two-row header with a thin divider. The first row identifies the timeframe. The second row shows candle status, an optional countdown when live, and the number of available displayed candles.
The live countdown refreshes when the chart receives updates; it is not an independent clock. When the market or data feed is inactive, it may not refresh every second.
Optional controls include latest-price labels, the high/low range of the displayed candles, highlighting the newest candle, aligned headers, divider visibility, header row spacing, panel text size, panel backgrounds, and custom colors. Main-chart candle coloring and a midnight background are optional and disabled by default.
Price-action labels
Patterns are calculated using the selected panel's OHLC data and, where needed, its immediately preceding candle. In the definitions below, body means the absolute difference between open and close; range means high minus low.
Zero-range candles are not assigned a pattern. Equal highs or lows do not qualify as inside or outside bars under these strict definitions.
Each candle receives at most one label. When more than one enabled condition is satisfied, priority is Engulfing, Pin Bar, Inside Bar, Outside Bar, then Doji. Each pattern type can be disabled separately. These labels classify candle shapes; they are not confirmed buy or sell instructions.
Closed-candle summary
The optional summary table uses the latest available closed candle in each panel's retrieved data:
The live price in a panel can therefore differ from the candle represented in the summary. The table can be moved to any of four corners or hidden. The Show PA labels setting controls the labels on the candles; individual pattern switches affect classification in both the panels and the summary.
Live candles, confirmation, and repainting
The newest candle can be developing. Its high, low, close, body direction, and pattern can change before it closes.
By default, price-action labels are displayed only for candles whose close time has been reached in the current execution context. Enabling Include unclosed candle also displays provisional patterns, marked with an asterisk (*). A provisional label can change or disappear before the candle closes. This option does not make the summary use developing candles.
The indicator is not presented as fully non-repainting. Requests use lookahead_off, but developing timeframe values still update. Historical or replay execution can differ from live execution, and a reloaded chart may not reproduce every intermediate live state. Historical higher-timeframe updates become available at the end of the relevant higher-timeframe candle rather than revealing its final values in advance.
For lower-timeframe panels, the script uses the latest snapshot available through request.security(). It does not reconstruct every intrabar update or preserve a complete historical event log. A closed-candle display filter should not be interpreted as a guarantee that all multi-timeframe behavior is identical between live, historical, and replay execution.
How to use
1. Add the indicator to a standard, time-based Candles or Bars chart.
2. Choose up to three panel timeframes and the desired number of candles.
3. Leave sufficient space on the right side of the chart, or scroll the chart left to expose the panels.
4. Compare candle bodies, wicks, and enabled pattern labels across the selected timeframes.
5. Read the closed-candle summary separately from the developing candle and current price.
6. Keep provisional labels disabled if you want labels only after the relevant candle close time.
7. Adjust panel spacing, price-label space, text size, and header row spacing to suit the chart zoom. Move or hide the summary if it overlaps other chart content.
Limitations
The indicator depends on the symbol's available data, trading sessions, chart updates, and TradingView timeframe support. A panel can contain fewer candles when insufficient data is available. It is intended for standard time-based charts, not synthetic chart types such as Heikin Ashi, Renko, or Range.
Only the current panel snapshots are drawn. This is not a complete historical pattern scanner or a strategy backtest. Horizontal spacing is reduced automatically when needed to keep drawing anchors within TradingView's forward-drawing limit. Text readability still depends on chart zoom and the selected layout settings.
This version does not generate alerts, place orders, calculate entry/stop-loss/take-profit levels, or report win rates and strategy performance. Candle patterns can fail and do not establish a trading edge by themselves. The indicator is intended for chart study and discretionary analysis; it does not provide investment advice or guarantee trading results.
The purpose is to compare the same symbol across timeframes without repeatedly changing the main chart interval. This is a visual analysis indicator, not a trading strategy or an automated entry and exit system.
How the display works
Each panel retrieves open, high, low, and close data from its selected timeframe. Candles are arranged from oldest on the left to newest on the right. The default configuration shows 10 candles for each of the 5-minute, 15-minute, and 30-minute timeframes. Each panel can be enabled, disabled, or assigned a different timeframe, with 3 to 30 candles per panel.
Panel timeframes may be lower than, equal to, or higher than the chart timeframe, subject to TradingView data availability. History is retrieved within each selected timeframe, rather than constructed by repeating or indexing values on the main chart interval.
Candles retain their actual OHLC prices on the chart's price scale. Their horizontal positions are display positions, not their original timestamps and not future price projections. A panel placed to the right of the latest chart bar does not represent a forecast.
Why these features are combined
The implementation connects three parts of the same review process: recent candle structure, the pattern classification of individual candles, and a compact closed-candle summary. This lets users inspect a pattern in the candle panel while checking the corresponding timeframe's latest closed body direction separately. The summary deliberately distinguishes body direction from pattern bias; for example, an upward-closing candle can meet the bearish Pin Bar conditions.
The candlestick patterns themselves are established concepts. The contribution is the configurable multi-timeframe presentation, the shared price scale, and the separation between developing candles and the closed-candle summary. No new predictive properties are claimed for these patterns.
Panel headers and visual controls
Each panel has a transparent two-row header with a thin divider. The first row identifies the timeframe. The second row shows candle status, an optional countdown when live, and the number of available displayed candles.
The live countdown refreshes when the chart receives updates; it is not an independent clock. When the market or data feed is inactive, it may not refresh every second.
Optional controls include latest-price labels, the high/low range of the displayed candles, highlighting the newest candle, aligned headers, divider visibility, header row spacing, panel text size, panel backgrounds, and custom colors. Main-chart candle coloring and a midnight background are optional and disabled by default.
Price-action labels
Patterns are calculated using the selected panel's OHLC data and, where needed, its immediately preceding candle. In the definitions below, body means the absolute difference between open and close; range means high minus low.
- ENG+ / ENG-: Bullish or bearish body engulfing. The current and previous candle bodies must have opposite directions. The current body must cover the previous body and be strictly larger. Wick engulfing is not required.
- PIN+ / PIN-: Bullish or bearish wick-rejection patterns. The body must be at least one minimum tick and no more than 35% of the candle's range. The longer wick must be at least the selected multiple of the body, with a default ratio of 2.0. The opposite wick must not exceed the body. A bullish pin must close in the upper 35% of the range; a bearish pin must close in the lower 35%. Body color does not determine pin direction.
- IB: Inside Bar. The current high is strictly below the preceding high, and the current low is strictly above the preceding low.
- OB: Outside Bar. The current high is strictly above the preceding high, and the current low is strictly below the preceding low.
- DOJI: The body is no more than the selected fraction of the candle's range, with a default threshold of 10%.
Zero-range candles are not assigned a pattern. Equal highs or lows do not qualify as inside or outside bars under these strict definitions.
Each candle receives at most one label. When more than one enabled condition is satisfied, priority is Engulfing, Pin Bar, Inside Bar, Outside Bar, then Doji. Each pattern type can be disabled separately. These labels classify candle shapes; they are not confirmed buy or sell instructions.
Closed-candle summary
The optional summary table uses the latest available closed candle in each panel's retrieved data:
- TIMEFRAME identifies the panel interval.
- CLOSED BODY shows BULL when close is above open, BEAR when close is below open, and FLAT when they are equal. This describes one candle's body, not an overall trend.
- PA shows the pattern, if any, on that same closed candle. It does not search backward for an older pattern.
- A dash means no enabled pattern was identified. OFF means the panel is disabled. NO DATA means no qualifying closed candle is available in the retrieved data.
The live price in a panel can therefore differ from the candle represented in the summary. The table can be moved to any of four corners or hidden. The Show PA labels setting controls the labels on the candles; individual pattern switches affect classification in both the panels and the summary.
Live candles, confirmation, and repainting
The newest candle can be developing. Its high, low, close, body direction, and pattern can change before it closes.
By default, price-action labels are displayed only for candles whose close time has been reached in the current execution context. Enabling Include unclosed candle also displays provisional patterns, marked with an asterisk (*). A provisional label can change or disappear before the candle closes. This option does not make the summary use developing candles.
The indicator is not presented as fully non-repainting. Requests use lookahead_off, but developing timeframe values still update. Historical or replay execution can differ from live execution, and a reloaded chart may not reproduce every intermediate live state. Historical higher-timeframe updates become available at the end of the relevant higher-timeframe candle rather than revealing its final values in advance.
For lower-timeframe panels, the script uses the latest snapshot available through request.security(). It does not reconstruct every intrabar update or preserve a complete historical event log. A closed-candle display filter should not be interpreted as a guarantee that all multi-timeframe behavior is identical between live, historical, and replay execution.
How to use
1. Add the indicator to a standard, time-based Candles or Bars chart.
2. Choose up to three panel timeframes and the desired number of candles.
3. Leave sufficient space on the right side of the chart, or scroll the chart left to expose the panels.
4. Compare candle bodies, wicks, and enabled pattern labels across the selected timeframes.
5. Read the closed-candle summary separately from the developing candle and current price.
6. Keep provisional labels disabled if you want labels only after the relevant candle close time.
7. Adjust panel spacing, price-label space, text size, and header row spacing to suit the chart zoom. Move or hide the summary if it overlaps other chart content.
Limitations
The indicator depends on the symbol's available data, trading sessions, chart updates, and TradingView timeframe support. A panel can contain fewer candles when insufficient data is available. It is intended for standard time-based charts, not synthetic chart types such as Heikin Ashi, Renko, or Range.
Only the current panel snapshots are drawn. This is not a complete historical pattern scanner or a strategy backtest. Horizontal spacing is reduced automatically when needed to keep drawing anchors within TradingView's forward-drawing limit. Text readability still depends on chart zoom and the selected layout settings.
This version does not generate alerts, place orders, calculate entry/stop-loss/take-profit levels, or report win rates and strategy performance. Candle patterns can fail and do not establish a trading edge by themselves. The indicator is intended for chart study and discretionary analysis; it does not provide investment advice or guarantee trading results.

免責事項
これらの情報および投稿は、TradingViewが提供または承認する金融、投資、取引、またはその他の種類の助言もしくは推奨であることを意図したものではなく、またこれらに該当するものでもありません。詳細は利用規約をご覧ください。
免責事項
これらの情報および投稿は、TradingViewが提供または承認する金融、投資、取引、またはその他の種類の助言もしくは推奨であることを意図したものではなく、またこれらに該当するものでもありません。詳細は利用規約をご覧ください。