OPEN-SOURCE SCRIPT
Body Length Bias
================================================================
BODY LENGTH BIAS — INDICATOR DESCRIPTION
================================================================
🇬🇧 ENGLISH
----------------------------------------------------------------
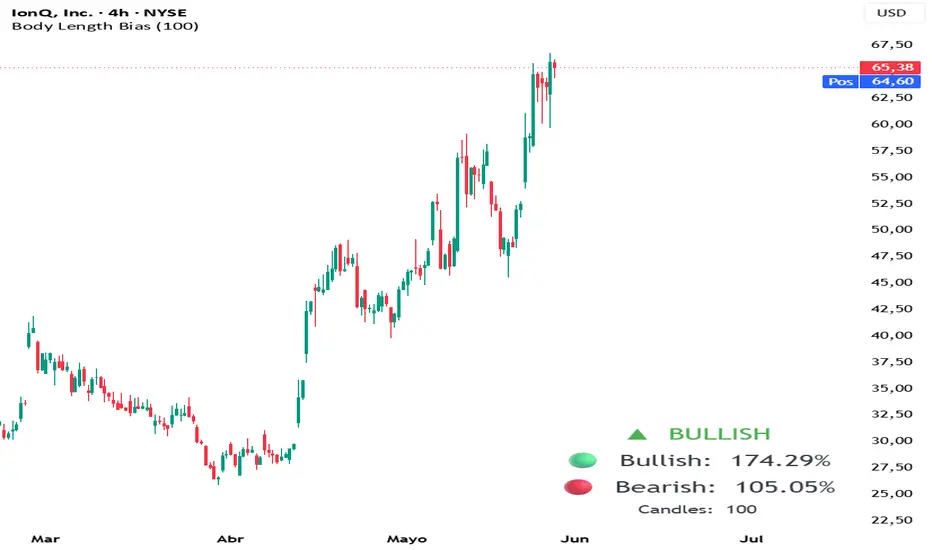
Body Length Bias is a directional pressure indicator that measures
the accumulated percentage movement of bullish and bearish candles
over a defined lookback period, revealing which side — buyers or
sellers — has exerted more real force on price.
WHAT IT CALCULATES
------------------
For each candle in the last X bars, the indicator calculates the
body movement as a percentage relative to the open price:
|close - open| / open * 100
It accumulates that percentage separately for bullish candles
(close >= open) and bearish candles (close < open). The side with
the higher total percentage is considered the dominant force.
WHAT IT SHOWS
-------------
A fixed label in the bottom-right corner of the chart displays:
- Current bias: BULLISH or BEARISH
- Accumulated percentage for each side
- Number of candles being analyzed
Background and text colors are fully customizable.
HOW TO USE IT
-------------
Trend filter:
Only look for long setups when bullish % > bearish %, and short
setups when bearish % > bullish %. Avoid trading against the
dominant side.
Range detection:
When both values are nearly equal (e.g. 50/50), the market is in
consolidation. No directional bias is present — wait for a breakout.
Exhaustion reading:
If one side has dominated for many candles but the gap is closing,
directional pressure is fading — a reversal may be forming.
Multi-timeframe confluence:
Apply the indicator on H4, H1, and 15m simultaneously. When all
three align in the same direction, confluence is at its highest.
WHAT IT DOES NOT DO
-------------------
This indicator does not generate entry signals. It is a contextual
bias tool designed to be used alongside structural analysis, key
levels, and volume. It works best in trending conditions and loses
reliability in tight sideways ranges.
================================================================
🇪🇸 ESPAÑOL
----------------------------------------------------------------
Body Length Bias es un indicador de presión direccional que mide
el movimiento porcentual acumulado de las velas alcistas y bajistas
durante un período definido, revelando qué lado — compradores o
vendedores — ha ejercido mayor fuerza real sobre el precio.
QUÉ CALCULA
-----------
Por cada vela de las últimas X barras, el indicador calcula el
movimiento del cuerpo como porcentaje respecto al precio de apertura:
|close - open| / open * 100
Ese porcentaje se acumula por separado para las velas alcistas
(close >= open) y las bajistas (close < open). El lado con mayor
porcentaje total es considerado la fuerza dominante.
QUÉ MUESTRA
-----------
Un cartel fijo en la esquina inferior derecha del gráfico muestra:
- Sesgo actual: BULLISH o BEARISH
- Porcentaje acumulado de cada lado
- Número de velas analizadas
El color de fondo y el color del texto son completamente configurables.
CÓMO USARLO
-----------
Filtro de dirección:
Busca solo largos cuando alcista % > bajista %, y solo cortos cuando
bajista % > alcista %. Evita operar contra el lado dominante.
Detección de rango:
Cuando ambos valores están casi igualados (ej. 50/50), el mercado
está en consolidación. No hay sesgo direccional — espera una ruptura.
Lectura de agotamiento:
Si un lado ha dominado durante muchas velas pero la diferencia se
está cerrando, la presión direccional se está agotando — puede estar
formándose un giro.
Confluencia multi-timeframe:
Aplica el indicador en H4, H1 y 15m simultáneamente. Cuando los
tres apuntan en la misma dirección, la confluencia es máxima.
QUÉ NO HACE
-----------
Este indicador no genera señales de entrada. Es una herramienta de
sesgo contextual diseñada para usarse junto con análisis estructural,
niveles clave y volumen. Funciona mejor en condiciones de tendencia
y pierde fiabilidad en rangos laterales ajustados.
================================================================
BODY LENGTH BIAS — INDICATOR DESCRIPTION
================================================================
🇬🇧 ENGLISH
----------------------------------------------------------------
Body Length Bias is a directional pressure indicator that measures
the accumulated percentage movement of bullish and bearish candles
over a defined lookback period, revealing which side — buyers or
sellers — has exerted more real force on price.
WHAT IT CALCULATES
------------------
For each candle in the last X bars, the indicator calculates the
body movement as a percentage relative to the open price:
|close - open| / open * 100
It accumulates that percentage separately for bullish candles
(close >= open) and bearish candles (close < open). The side with
the higher total percentage is considered the dominant force.
WHAT IT SHOWS
-------------
A fixed label in the bottom-right corner of the chart displays:
- Current bias: BULLISH or BEARISH
- Accumulated percentage for each side
- Number of candles being analyzed
Background and text colors are fully customizable.
HOW TO USE IT
-------------
Trend filter:
Only look for long setups when bullish % > bearish %, and short
setups when bearish % > bullish %. Avoid trading against the
dominant side.
Range detection:
When both values are nearly equal (e.g. 50/50), the market is in
consolidation. No directional bias is present — wait for a breakout.
Exhaustion reading:
If one side has dominated for many candles but the gap is closing,
directional pressure is fading — a reversal may be forming.
Multi-timeframe confluence:
Apply the indicator on H4, H1, and 15m simultaneously. When all
three align in the same direction, confluence is at its highest.
WHAT IT DOES NOT DO
-------------------
This indicator does not generate entry signals. It is a contextual
bias tool designed to be used alongside structural analysis, key
levels, and volume. It works best in trending conditions and loses
reliability in tight sideways ranges.
================================================================
🇪🇸 ESPAÑOL
----------------------------------------------------------------
Body Length Bias es un indicador de presión direccional que mide
el movimiento porcentual acumulado de las velas alcistas y bajistas
durante un período definido, revelando qué lado — compradores o
vendedores — ha ejercido mayor fuerza real sobre el precio.
QUÉ CALCULA
-----------
Por cada vela de las últimas X barras, el indicador calcula el
movimiento del cuerpo como porcentaje respecto al precio de apertura:
|close - open| / open * 100
Ese porcentaje se acumula por separado para las velas alcistas
(close >= open) y las bajistas (close < open). El lado con mayor
porcentaje total es considerado la fuerza dominante.
QUÉ MUESTRA
-----------
Un cartel fijo en la esquina inferior derecha del gráfico muestra:
- Sesgo actual: BULLISH o BEARISH
- Porcentaje acumulado de cada lado
- Número de velas analizadas
El color de fondo y el color del texto son completamente configurables.
CÓMO USARLO
-----------
Filtro de dirección:
Busca solo largos cuando alcista % > bajista %, y solo cortos cuando
bajista % > alcista %. Evita operar contra el lado dominante.
Detección de rango:
Cuando ambos valores están casi igualados (ej. 50/50), el mercado
está en consolidación. No hay sesgo direccional — espera una ruptura.
Lectura de agotamiento:
Si un lado ha dominado durante muchas velas pero la diferencia se
está cerrando, la presión direccional se está agotando — puede estar
formándose un giro.
Confluencia multi-timeframe:
Aplica el indicador en H4, H1 y 15m simultáneamente. Cuando los
tres apuntan en la misma dirección, la confluencia es máxima.
QUÉ NO HACE
-----------
Este indicador no genera señales de entrada. Es una herramienta de
sesgo contextual diseñada para usarse junto con análisis estructural,
niveles clave y volumen. Funciona mejor en condiciones de tendencia
y pierde fiabilidad en rangos laterales ajustados.
================================================================
オープンソーススクリプト
TradingViewの精神に則り、このスクリプトの作者はコードをオープンソースとして公開してくれました。トレーダーが内容を確認・検証できるようにという配慮です。作者に拍手を送りましょう!無料で利用できますが、コードの再公開はハウスルールに従う必要があります。

免責事項
これらの情報および投稿は、TradingViewが提供または承認する金融、投資、取引、またはその他の種類の助言もしくは推奨であることを意図したものではなく、またこれらに該当するものでもありません。詳細は利用規約をご覧ください。
オープンソーススクリプト
TradingViewの精神に則り、このスクリプトの作者はコードをオープンソースとして公開してくれました。トレーダーが内容を確認・検証できるようにという配慮です。作者に拍手を送りましょう!無料で利用できますが、コードの再公開はハウスルールに従う必要があります。
免責事項
これらの情報および投稿は、TradingViewが提供または承認する金融、投資、取引、またはその他の種類の助言もしくは推奨であることを意図したものではなく、またこれらに該当するものでもありません。詳細は利用規約をご覧ください。