Heartland Previous-Day Pivot Levels
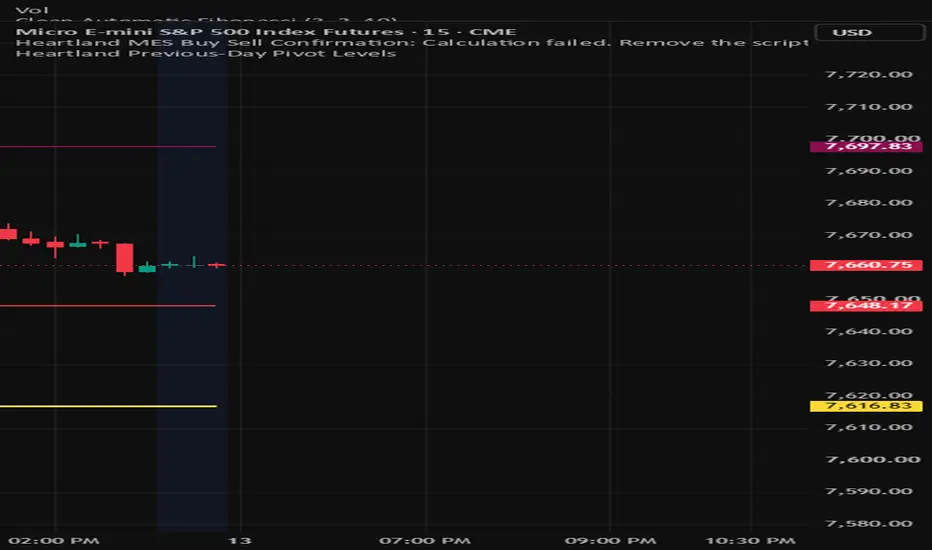
This indicator calculates traditional pivot levels using the previous completed trading day’s high, low and closing price. It displays the central equilibrium pivot, R1 and R2 resistance levels, and S1 and S2 support levels. The levels update automatically at the beginning of each new trading day and can help traders identify market direction, potential support and resistance, and possible profit targets. This indicator is intended for educational and market-analysis purposes only and should not be considered financial advice.

免責事項
これらの情報および投稿は、TradingViewが提供または承認する金融、投資、取引、またはその他の種類の助言もしくは推奨であることを意図したものではなく、またこれらに該当するものでもありません。詳細は利用規約をご覧ください。
免責事項
これらの情報および投稿は、TradingViewが提供または承認する金融、投資、取引、またはその他の種類の助言もしくは推奨であることを意図したものではなく、またこれらに該当するものでもありません。詳細は利用規約をご覧ください。