Date & Season Highlight
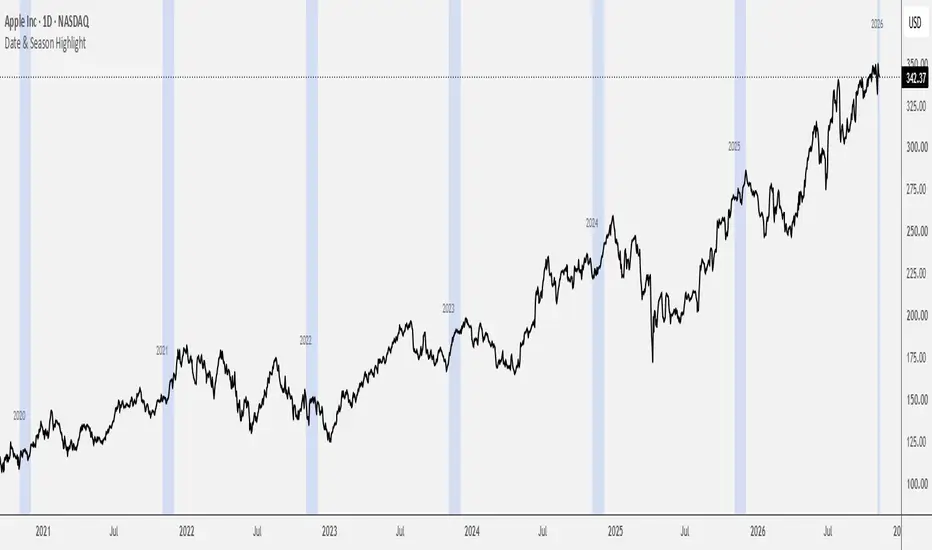
This Script indicator is designed to visually isolate and highlight specific months or years directly on your chart using background coloring. It serves as a practical tool for seasonality analysis, allowing you to instantly track and compare historical price behavior during specific periods of interest.
📊 Key Features:
Auto-Detect Mode (Live): Automatically identifies the current calendar month and highlights it across all historical data on your chart.
Manual Month Filter: Allows you to select any individual month (e.g., "July") to isolate past seasonal patterns.
Flexible Year Filter: Offers the ability to lock onto a single specific year or set the value to 0 to reveal the selected month across every year available in the history.
Dynamic Year Labels: Automatically prints clean, unobtrusive text labels at the beginning of each highlighted zone to keep your temporal perspective perfectly organized.
📊 Key Features:
Auto-Detect Mode (Live): Automatically identifies the current calendar month and highlights it across all historical data on your chart.
Manual Month Filter: Allows you to select any individual month (e.g., "July") to isolate past seasonal patterns.
Flexible Year Filter: Offers the ability to lock onto a single specific year or set the value to 0 to reveal the selected month across every year available in the history.
Dynamic Year Labels: Automatically prints clean, unobtrusive text labels at the beginning of each highlighted zone to keep your temporal perspective perfectly organized.

免責事項
これらの情報および投稿は、TradingViewが提供または承認する金融、投資、取引、またはその他の種類の助言もしくは推奨であることを意図したものではなく、またこれらに該当するものでもありません。詳細は利用規約をご覧ください。
免責事項
これらの情報および投稿は、TradingViewが提供または承認する金融、投資、取引、またはその他の種類の助言もしくは推奨であることを意図したものではなく、またこれらに該当するものでもありません。詳細は利用規約をご覧ください。