OPEN-SOURCE SCRIPT
Multi-Index VWAP Dashboard
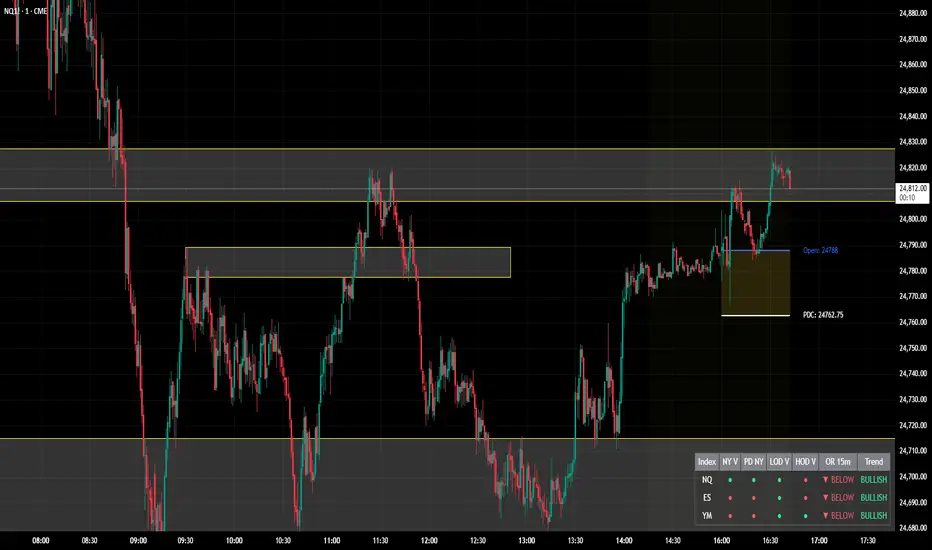
To post this on the TradingView Community Scripts, you want a description that highlights its multi-instrument correlation and institutional session data. It’s not just a VWAP indicator; it’s a "Tape Reading" dashboard for index traders.
Here is a structured description you can copy and paste:
Description
Overview
The Multi-Index Institutional VWAP Dashboard is a high-performance Tape Reading tool designed for NQ, ES, and YM traders. It provides a real-time "at-a-glance" matrix of how the three major US Indices are performing relative to critical institutional benchmarks. Instead of cluttering your main chart with dozens of lines, this dashboard compiles the data into a clean, Bookmap-inspired UI.
Key Benchmarks Tracked
The dashboard monitors price action for NQ, ES, and YM against:
NY VWAP: Anchored specifically to the New York Open (09:30 AM ET).
PD NY VWAP: The closing value of the previous day's New York session VWAP—a major level for institutional mean reversion.
LOD/HOD Anchored VWAP: Dynamic VWAPs that re-anchor automatically to the current Day's High and Day's Low.
15m Opening Range (OR): Detects if price is trading Inside, Above (▲), or Below (▼) the first 15 minutes of the NY session.
Trend Matrix: A real-time momentum filter for each index to identify cross-market divergence.
Features
Bookmap Style Visuals: Uses custom bubble icons (◎) for a modern, heat-map aesthetic.
Timezone Optimized: Hard-coded for New York Session hours while respecting your local chart offset.
Customizable Layout: Full control over dashboard position (Top/Bottom/Corners) and text sizing to fit any monitor resolution.
Cross-Index Correlation: Easily spot "SMT Divergence" (e.g., when NQ is above its NY VWAP but ES is below it).
How to Use
Bullish Confirmation: Look for "All Green" bubbles across all three indices, specifically price holding above the NY VWAP and OR High.
Mean Reversion: Use the PD NY VWAP and HOD/LOD VWAP as targets or areas of interest for potential reversals.
Trend Divergence: If NQ is showing "Bullish" while YM is showing "Bearish," exercise caution as the indices are decoupled.
Settings Tips
Position: Move the dashboard to the "Bottom Right" if you have other indicators at the top.
Style: Toggle between "Solid," "Bubble," or "Ring" icons in the script settings to match your chart's theme.
Here is a structured description you can copy and paste:
Description
Overview
The Multi-Index Institutional VWAP Dashboard is a high-performance Tape Reading tool designed for NQ, ES, and YM traders. It provides a real-time "at-a-glance" matrix of how the three major US Indices are performing relative to critical institutional benchmarks. Instead of cluttering your main chart with dozens of lines, this dashboard compiles the data into a clean, Bookmap-inspired UI.
Key Benchmarks Tracked
The dashboard monitors price action for NQ, ES, and YM against:
NY VWAP: Anchored specifically to the New York Open (09:30 AM ET).
PD NY VWAP: The closing value of the previous day's New York session VWAP—a major level for institutional mean reversion.
LOD/HOD Anchored VWAP: Dynamic VWAPs that re-anchor automatically to the current Day's High and Day's Low.
15m Opening Range (OR): Detects if price is trading Inside, Above (▲), or Below (▼) the first 15 minutes of the NY session.
Trend Matrix: A real-time momentum filter for each index to identify cross-market divergence.
Features
Bookmap Style Visuals: Uses custom bubble icons (◎) for a modern, heat-map aesthetic.
Timezone Optimized: Hard-coded for New York Session hours while respecting your local chart offset.
Customizable Layout: Full control over dashboard position (Top/Bottom/Corners) and text sizing to fit any monitor resolution.
Cross-Index Correlation: Easily spot "SMT Divergence" (e.g., when NQ is above its NY VWAP but ES is below it).
How to Use
Bullish Confirmation: Look for "All Green" bubbles across all three indices, specifically price holding above the NY VWAP and OR High.
Mean Reversion: Use the PD NY VWAP and HOD/LOD VWAP as targets or areas of interest for potential reversals.
Trend Divergence: If NQ is showing "Bullish" while YM is showing "Bearish," exercise caution as the indices are decoupled.
Settings Tips
Position: Move the dashboard to the "Bottom Right" if you have other indicators at the top.
Style: Toggle between "Solid," "Bubble," or "Ring" icons in the script settings to match your chart's theme.
オープンソーススクリプト
TradingViewの精神に則り、このスクリプトの作者はコードをオープンソースとして公開してくれました。トレーダーが内容を確認・検証できるようにという配慮です。作者に拍手を送りましょう!無料で利用できますが、コードの再公開はハウスルールに従う必要があります。

免責事項
これらの情報および投稿は、TradingViewが提供または承認する金融、投資、取引、またはその他の種類の助言もしくは推奨であることを意図したものではなく、またこれらに該当するものでもありません。詳細は利用規約をご覧ください。
オープンソーススクリプト
TradingViewの精神に則り、このスクリプトの作者はコードをオープンソースとして公開してくれました。トレーダーが内容を確認・検証できるようにという配慮です。作者に拍手を送りましょう!無料で利用できますが、コードの再公開はハウスルールに従う必要があります。
免責事項
これらの情報および投稿は、TradingViewが提供または承認する金融、投資、取引、またはその他の種類の助言もしくは推奨であることを意図したものではなく、またこれらに該当するものでもありません。詳細は利用規約をご覧ください。