OPEN-SOURCE SCRIPT
更新済 Vertical Lines Past+Future
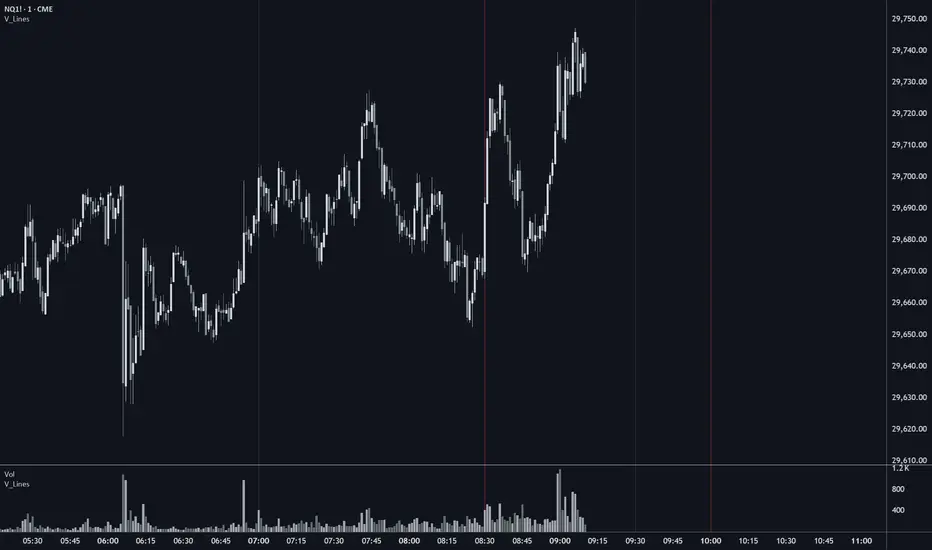
This indicator plots up to 5 vertical lines at specific times, both on previous days AND the upcoming instances of the current day.
Change times, colors, style and width.
With time zone support.
The indicator fetches the midnight UNIX timestamp and adds the duration till the specified times from midnight to get the x-values for the positioning of upcoming lines.
One limitation is that when a chart is set to RTH the indicator will only start to plot the upcoming lines when the session has started.
Change times, colors, style and width.
With time zone support.
The indicator fetches the midnight UNIX timestamp and adds the duration till the specified times from midnight to get the x-values for the positioning of upcoming lines.
One limitation is that when a chart is set to RTH the indicator will only start to plot the upcoming lines when the session has started.
リリースノート
Added "scale.none" constant so you won't have to merge scales when using it in an indicator pane.オープンソーススクリプト
TradingViewの精神に則り、このスクリプトの作者はコードをオープンソースとして公開してくれました。トレーダーが内容を確認・検証できるようにという配慮です。作者に拍手を送りましょう!無料で利用できますが、コードの再公開はハウスルールに従う必要があります。

免責事項
これらの情報および投稿は、TradingViewが提供または承認する金融、投資、取引、またはその他の種類の助言もしくは推奨であることを意図したものではなく、またこれらに該当するものでもありません。詳細は利用規約をご覧ください。
オープンソーススクリプト
TradingViewの精神に則り、このスクリプトの作者はコードをオープンソースとして公開してくれました。トレーダーが内容を確認・検証できるようにという配慮です。作者に拍手を送りましょう!無料で利用できますが、コードの再公開はハウスルールに従う必要があります。
免責事項
これらの情報および投稿は、TradingViewが提供または承認する金融、投資、取引、またはその他の種類の助言もしくは推奨であることを意図したものではなく、またこれらに該当するものでもありません。詳細は利用規約をご覧ください。