OPEN-SOURCE SCRIPT
MA Envelope 15%
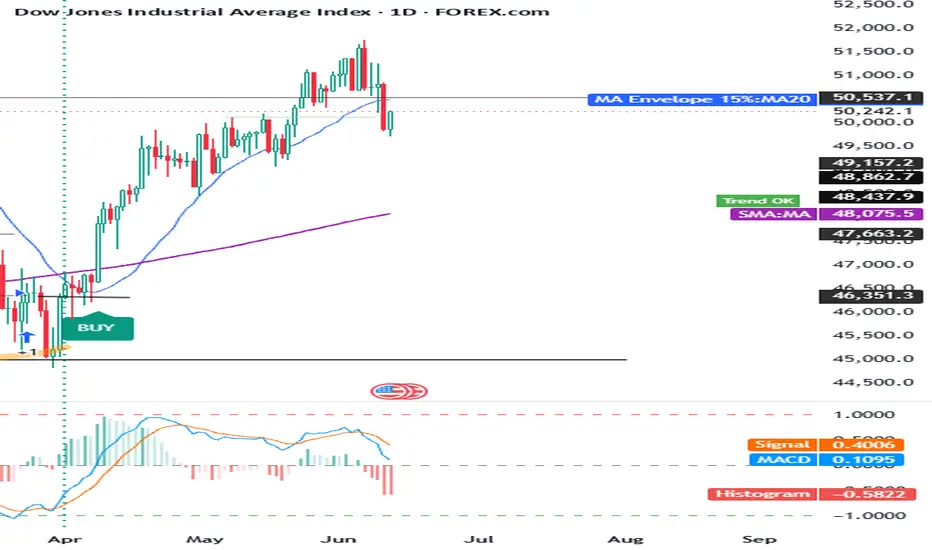
Traders use this type of indicator to identify extreme price deviations, potential mean reversion opportunities, and trend strength. When price moves near or beyond the upper band, it may suggest overextension or overbought conditions. When price approaches the lower band, it may indicate oversold conditions or potential value zones.
Overall, this indicator is a simple but effective way to visualize volatility boundaries around a trend and to support decision-making in trend-following or mean-reversion strategies.
You can adjust the % yourself according to your instrument.
Overall, this indicator is a simple but effective way to visualize volatility boundaries around a trend and to support decision-making in trend-following or mean-reversion strategies.
You can adjust the % yourself according to your instrument.
オープンソーススクリプト
TradingViewの精神に則り、このスクリプトの作者はコードをオープンソースとして公開してくれました。トレーダーが内容を確認・検証できるようにという配慮です。作者に拍手を送りましょう!無料で利用できますが、コードの再公開はハウスルールに従う必要があります。

免責事項
これらの情報および投稿は、TradingViewが提供または承認する金融、投資、取引、またはその他の種類の助言もしくは推奨であることを意図したものではなく、またこれらに該当するものでもありません。詳細は利用規約をご覧ください。
オープンソーススクリプト
TradingViewの精神に則り、このスクリプトの作者はコードをオープンソースとして公開してくれました。トレーダーが内容を確認・検証できるようにという配慮です。作者に拍手を送りましょう!無料で利用できますが、コードの再公開はハウスルールに従う必要があります。
免責事項
これらの情報および投稿は、TradingViewが提供または承認する金融、投資、取引、またはその他の種類の助言もしくは推奨であることを意図したものではなく、またこれらに該当するものでもありません。詳細は利用規約をご覧ください。