HTF Key Level Breakout BY *RAVI
OVERVIEW
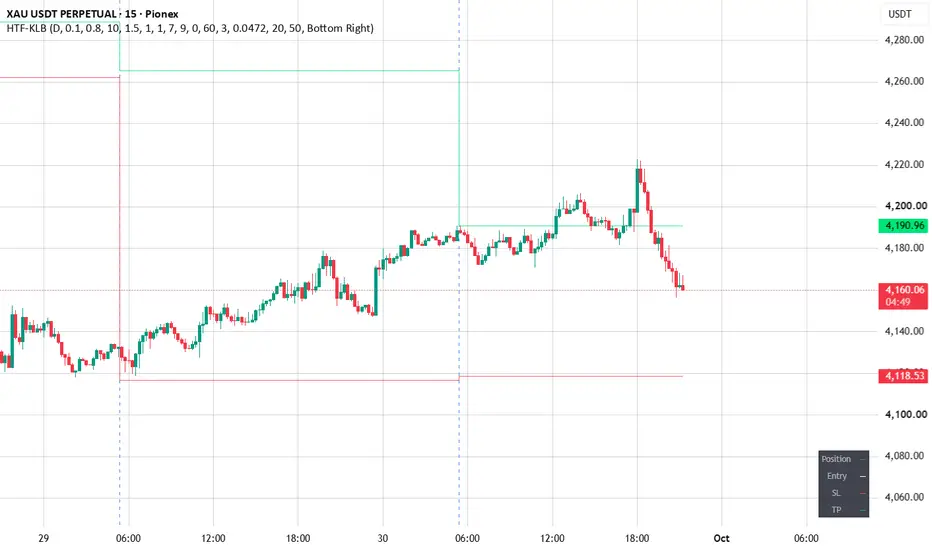
This indicator automates a multi-timeframe liquidity model built around three events that must occur in strict sequence: a sweep of higher-timeframe liquidity, the inversion of a Fair Value Gap, and a lower-timeframe double Break of Structure. It is designed and tested primarily on Gold (XAUUSD), but works on any liquid instrument.
The goal is not to signal every sweep or every FVG. It waits for the full chain to complete and only then marks a potential entry, filtering out the many sweeps that simply continue in the original direction.
HOW IT WORKS
1. 1H Liquidity Anchor
The high and low of the PREVIOUS CLOSED 1-hour candle are plotted as liquidity levels. Only a closed candle is used, so the levels never repaint.
2. 5m Sweep Detection
On the 5-minute timeframe, the script waits for price to trade beyond the 1H high or low. A sweep of the high sets up a potential bearish model; a sweep of the low sets up a potential bullish model.
3. Fair Value Gap (Old Direction)
After the sweep, the script marks the FVG formed in the direction of the sweep — the gap created by the move INTO the liquidity. This is the gap that must fail.
4. Inversion (IFVG)
When price closes back through that FVG in the opposite direction, the gap is considered inverted. This is the first evidence that the sweep was a liquidity grab rather than a genuine breakout.
5. 1m Double BOS Confirmation
On the 1-minute timeframe the script requires:
- a BOS in the new bias direction,
- a counter-BOS against the bias,
- a second BOS back in the bias direction.
The entry signal prints only after the second BOS.
VISUALS
- 1H high/low liquidity lines
- Sweep markers
- FVG boxes (changing colour once inverted)
- BOS labels on the confirmation sequence
- Entry label with direction
ALERTS
Alerts are available for sweep, FVG inversion and final entry, so the model can be monitored without watching the chart.
HOW TO USE
- Apply to a 1-minute chart for full confirmation detail; the script requests 5m and 1H data internally.
- Treat the entry label as a setup that has met every condition, not as a guaranteed trade.
- Place stops according to your own risk rules, typically beyond the sweep extreme.
- Best suited to active sessions (London and New York for Gold).
LIMITATIONS
- Requires sufficient intraday history; results on low-liquidity symbols may be unreliable.
- Lower-timeframe data availability depends on your TradingView plan.
- Every stage must complete in order; if the sequence breaks, the setup is reset.
DISCLAIMER
This script is for educational and analytical purposes only. It does not constitute financial advice. Past behaviour of any pattern does not guarantee future results. Always test on your own data and manage risk appropriately.
This indicator automates a multi-timeframe liquidity model built around three events that must occur in strict sequence: a sweep of higher-timeframe liquidity, the inversion of a Fair Value Gap, and a lower-timeframe double Break of Structure. It is designed and tested primarily on Gold (XAUUSD), but works on any liquid instrument.
The goal is not to signal every sweep or every FVG. It waits for the full chain to complete and only then marks a potential entry, filtering out the many sweeps that simply continue in the original direction.
HOW IT WORKS
1. 1H Liquidity Anchor
The high and low of the PREVIOUS CLOSED 1-hour candle are plotted as liquidity levels. Only a closed candle is used, so the levels never repaint.
2. 5m Sweep Detection
On the 5-minute timeframe, the script waits for price to trade beyond the 1H high or low. A sweep of the high sets up a potential bearish model; a sweep of the low sets up a potential bullish model.
3. Fair Value Gap (Old Direction)
After the sweep, the script marks the FVG formed in the direction of the sweep — the gap created by the move INTO the liquidity. This is the gap that must fail.
4. Inversion (IFVG)
When price closes back through that FVG in the opposite direction, the gap is considered inverted. This is the first evidence that the sweep was a liquidity grab rather than a genuine breakout.
5. 1m Double BOS Confirmation
On the 1-minute timeframe the script requires:
- a BOS in the new bias direction,
- a counter-BOS against the bias,
- a second BOS back in the bias direction.
The entry signal prints only after the second BOS.
VISUALS
- 1H high/low liquidity lines
- Sweep markers
- FVG boxes (changing colour once inverted)
- BOS labels on the confirmation sequence
- Entry label with direction
ALERTS
Alerts are available for sweep, FVG inversion and final entry, so the model can be monitored without watching the chart.
HOW TO USE
- Apply to a 1-minute chart for full confirmation detail; the script requests 5m and 1H data internally.
- Treat the entry label as a setup that has met every condition, not as a guaranteed trade.
- Place stops according to your own risk rules, typically beyond the sweep extreme.
- Best suited to active sessions (London and New York for Gold).
LIMITATIONS
- Requires sufficient intraday history; results on low-liquidity symbols may be unreliable.
- Lower-timeframe data availability depends on your TradingView plan.
- Every stage must complete in order; if the sequence breaks, the setup is reset.
DISCLAIMER
This script is for educational and analytical purposes only. It does not constitute financial advice. Past behaviour of any pattern does not guarantee future results. Always test on your own data and manage risk appropriately.

免責事項
これらの情報および投稿は、TradingViewが提供または承認する金融、投資、取引、またはその他の種類の助言もしくは推奨であることを意図したものではなく、またこれらに該当するものでもありません。詳細は利用規約をご覧ください。
免責事項
これらの情報および投稿は、TradingViewが提供または承認する金融、投資、取引、またはその他の種類の助言もしくは推奨であることを意図したものではなく、またこれらに該当するものでもありません。詳細は利用規約をご覧ください。