アップデート済
Rally Finder
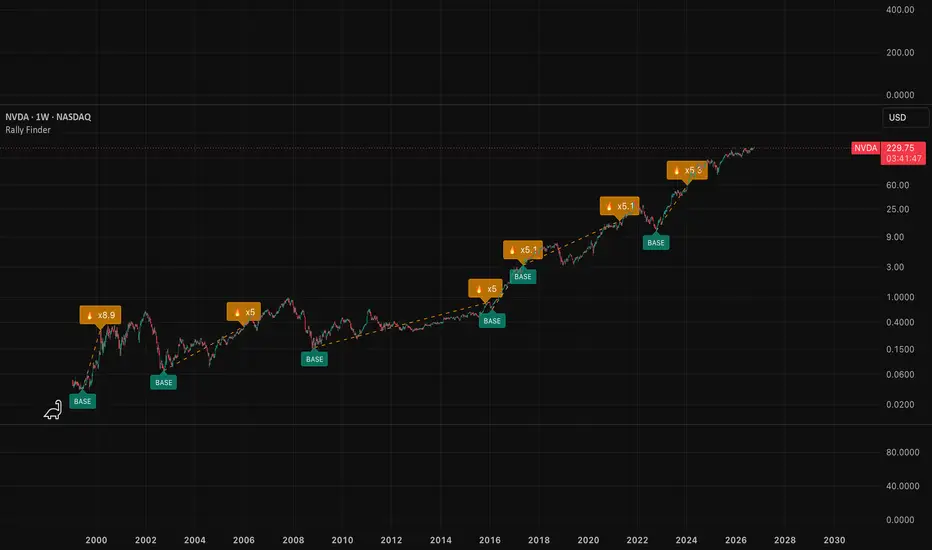
📌 Description:
Rally Finder is a simple tool that marks where price has rallied by a chosen multiple from its base. It helps you quickly spot explosive moves on any chart, such as 5x, 10x or 100x runs, without measuring them by hand.
📌 How It Works:
1. Base Tracking:
The script tracks the lowest close since the last signal and uses it as the base.
2. Rally Detection:
When price reaches the chosen multiple of the base (default 5x), a signal is printed.
You can choose the target price:
- High (default): includes wicks.
- Close: only counts if the bar closes at or above the target.
3. Reset:
After a signal, the base resets to that bar's close, and tracking starts again from there. If price falls below the new base, the base moves down to the new lowest close.
This means large rallies can print multiple signals. With the default 5x, signals appear at roughly 5x, 25x and 125x from the original base.
📌 Visual Representation:
- 🔥 xN Label: Shown above the signal bar with the actual multiple reached.
- BASE Label: Marks the lowest close the rally started from. (Can be toggled.)
- Dashed Line: Connects the base to the signal bar. (Can be toggled.)
📌 Settings:
- Rally Multiplier (x): The multiple required to trigger a signal (default 5).
- Target Price: High or Close.
- Show Base Label / Draw Line: Turn visual elements on or off.
📌 Usage:
- Works on any market and timeframe. Weekly and monthly charts are best for spotting long-term multi-bagger runs.
- Useful for studying past explosive moves, comparing how often an asset makes big rallies, or setting alerts when a new one happens.
- Built-in alert (Rally Hit) notifies you when a new rally signal occurs.
📌 Note:
This indicator marks rallies after they happen. It is not a buy or sell signal by itself.
Rally Finder is a simple tool that marks where price has rallied by a chosen multiple from its base. It helps you quickly spot explosive moves on any chart, such as 5x, 10x or 100x runs, without measuring them by hand.
📌 How It Works:
1. Base Tracking:
The script tracks the lowest close since the last signal and uses it as the base.
2. Rally Detection:
When price reaches the chosen multiple of the base (default 5x), a signal is printed.
You can choose the target price:
- High (default): includes wicks.
- Close: only counts if the bar closes at or above the target.
3. Reset:
After a signal, the base resets to that bar's close, and tracking starts again from there. If price falls below the new base, the base moves down to the new lowest close.
This means large rallies can print multiple signals. With the default 5x, signals appear at roughly 5x, 25x and 125x from the original base.
📌 Visual Representation:
- 🔥 xN Label: Shown above the signal bar with the actual multiple reached.
- BASE Label: Marks the lowest close the rally started from. (Can be toggled.)
- Dashed Line: Connects the base to the signal bar. (Can be toggled.)
📌 Settings:
- Rally Multiplier (x): The multiple required to trigger a signal (default 5).
- Target Price: High or Close.
- Show Base Label / Draw Line: Turn visual elements on or off.
📌 Usage:
- Works on any market and timeframe. Weekly and monthly charts are best for spotting long-term multi-bagger runs.
- Useful for studying past explosive moves, comparing how often an asset makes big rallies, or setting alerts when a new one happens.
- Built-in alert (Rally Hit) notifies you when a new rally signal occurs.
📌 Note:
This indicator marks rallies after they happen. It is not a buy or sell signal by itself.
リリースノート
📌 Update: Fixed false signals on large bearish bars. A bar can no longer trigger a signal from its own close.
免責事項
これらの情報および投稿は、TradingViewが提供または承認する金融、投資、取引、またはその他の種類の助言もしくは推奨であることを意図したものではなく、またこれらに該当するものでもありません。詳細は利用規約をご覧ください。
免責事項
これらの情報および投稿は、TradingViewが提供または承認する金融、投資、取引、またはその他の種類の助言もしくは推奨であることを意図したものではなく、またこれらに該当するものでもありません。詳細は利用規約をご覧ください。