OPEN-SOURCE SCRIPT
[ A L P H A X ] Pulse Scalper
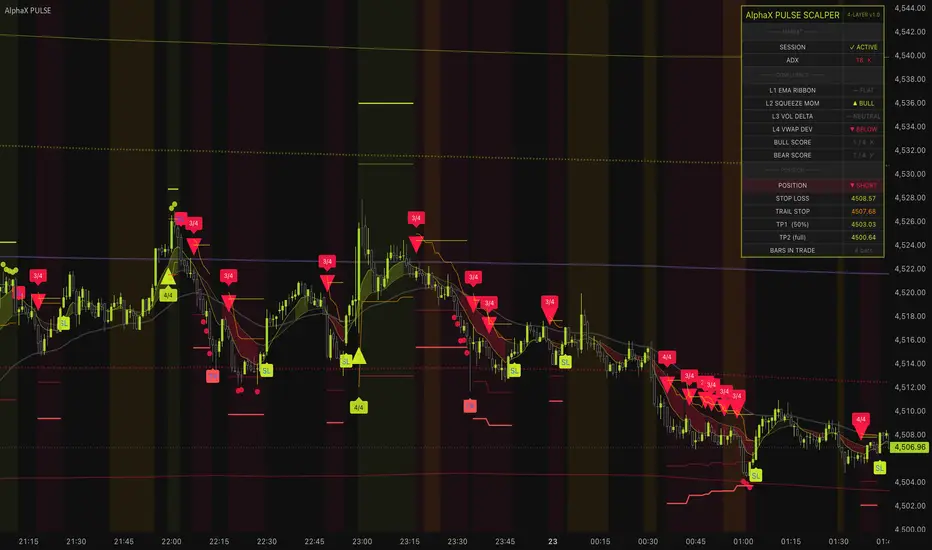
AlphaX Pulse Scalper — 4-Layer Confluence Scalping System with ATR Trailing Exits, Squeeze Momentum Detection & Live Scoring Dashboard
AlphaX Pulse Scalper is a professional-grade multi-confluence scalping system engineered to fire only when four independent technical engines simultaneously agree on direction. Unlike single-indicator systems that generate signals from one source of information, Pulse Scalper runs a live scoring gate across an EMA Ribbon, a Squeeze Momentum engine, a Volume Delta pressure model, and a VWAP Deviation filter — every bar, on every candle. A signal only reaches your chart when at least three of the four layers confirm. The result is a dramatically lower signal count with a dramatically higher average quality per signal. Designed for active scalpers on crypto, forex, gold, and indices across the 1-minute to 15-minute timeframes.
━━━━━━━━━━━━━━━━━━━━━━━━━━━━━━━━━━━━━━━━
🔬 The 4-Layer Confluence Engine — How It Works
Most scalping indicators fire from a single calculation — a crossover, a threshold breach, a momentum flip. The problem is that any single calculation is easily fooled by noise, spikes, and choppy price action. AlphaX Pulse Scalper is built on a fundamentally different architecture: four completely independent layers, each measuring a different dimension of market behavior, each casting a vote on every bar. Only when enough votes align does a signal fire.
This is not a filter applied on top of a signal. The confluence is the signal.
━━━━━━━━━━━━━━━━━━━━━━━━━━━━━━━━━━━━━━━━
📐 Layer 1 — EMA Ribbon (Trend Structure)
The first layer is a triple EMA ribbon using a Fast EMA (default: 8), Slow EMA (default: 21), and Signal EMA (default: 50). This layer answers a single question: is the market in a clean, structured trend right now?
Bull condition: Fast EMA above Slow EMA, Slow EMA above Signal EMA, and price closing above all three — a full stack alignment confirming upward momentum structure.
Bear condition: The full inverse — Fast below Slow below Signal, with price below all three.
Why this matters: The ribbon does not react to a single crossover. All three EMAs must be stacked in order and price must be on the correct side. This eliminates the vast majority of false crossover signals that plague simple dual-EMA systems. The ribbon is also plotted directly on the chart as a gradient-filled channel — bull fills in yellow-green, bear fills in red — giving you immediate structural context at a glance.
━━━━━━━━━━━━━━━━━━━━━━━━━━━━━━━━━━━━━━━━
⚡ Layer 2 — Squeeze Momentum (Energy Detection)
The second layer is built on the TTM Squeeze principle — one of the most reliable pre-breakout detection systems in technical analysis. It works by measuring the relationship between two volatility envelopes: Bollinger Bands and Keltner Channels.
Squeeze state: When the Bollinger Bands compress inside the Keltner Channels, the market is coiling — volatility has contracted and energy is building. These periods of compression historically precede the strongest directional moves. The squeeze state is displayed as a subtle orange background tint on the chart, and flagged on the dashboard as ⚡ BUILDING — giving you advance warning that a breakout is loading before it happens.
Momentum direction: The raw momentum value is calculated using a linear regression of price position relative to the midpoint of the recent high-low range. When this value is positive and rising, the squeeze is releasing to the upside. When negative and falling, it is releasing to the downside.
Layer 2 votes bull when: Momentum value is above zero and accelerating upward.
Layer 2 votes bear when: Momentum value is below zero and accelerating downward.
Why this matters: This layer catches the energy behind a move, not just the direction. A breakout with strong squeeze momentum behind it is fundamentally different from a breakout on low momentum — and this layer distinguishes between the two on every bar.
━━━━━━━━━━━━━━━━━━━━━━━━━━━━━━━━━━━━━━━━
📊 Layer 3 — Volume Delta (Institutional Pressure)
The third layer is a proprietary volume delta model that estimates the real buying and selling pressure behind each candle — without requiring exchange-level order flow data.
How it works: Each candle's volume is split into bullish and bearish components based on the candle's close position within its high-low range. A candle closing near its high attributes most of its volume to buyers; a candle closing near its low attributes most to sellers. These estimates are smoothed using an EMA to eliminate single-bar noise. A secondary OBV slope (On-Balance Volume) is calculated over the configured lookback and used as an independent confirmation of the dominant pressure direction.
Layer 3 votes bull when: The bull volume EMA exceeds the bear volume EMA, the delta EMA is positive, and the OBV slope is rising — all three volume signals agree on buying pressure.
Layer 3 votes bear when: The full inverse — bear volume dominates, delta EMA is negative, OBV slope is falling.
Why this matters: Price can move in any direction on any bar. Volume delta tells you whether real capital is flowing in the direction of that move. A price breakout accompanied by genuine volume pressure is a high-confidence breakout. A price breakout on weak or opposing volume is a trap. This layer is the system's protection against price manipulation and false breakouts.
━━━━━━━━━━━━━━━━━━━━━━━━━━━━━━━━━━━━━━━━
📡 Layer 4 — VWAP Deviation (Institutional Bias)
The fourth layer uses the Volume Weighted Average Price (VWAP) with dynamically calculated standard deviation bands to identify where price stands relative to institutional value.
Band structure: Two band pairs are calculated — ±1σ and ±2σ — using a volume-weighted standard deviation formula applied across the session. These bands represent statistically significant deviations from the session's fair value anchor.
Layer 4 votes bull when: Price is above VWAP (institutional bias is bullish) but has not yet extended beyond the +2σ band — confirming trend direction without chasing a stretched, overextended move.
Layer 4 votes bear when: Price is below VWAP but has not extended beyond the -2σ band.
Why this matters: VWAP is the single most widely watched intraday reference level used by institutional desks, market makers, and algorithms. Price above VWAP means institutions are net buyers for the session. Price below means net sellers. The 2σ filter prevents the system from entering during climactic exhaustion moves — precisely the moments when reversal risk is highest and reward is lowest.
The bands are plotted directly on the chart — VWAP as a purple line, ±1σ as dotted yellow-green and red circles, ±2σ as solid outer boundaries — so you always have the full VWAP context visible alongside your signals.
━━━━━━━━━━━━━━━━━━━━━━━━━━━━━━━━━━━━━━━━
🧠 The Confluence Gate — Live Scoring System
On every bar, each of the four layers independently casts its vote. The results are tallied into a live confluence score displayed in real time on the dashboard.
Bull score: 0–4 points. One point for each layer voting bullish.
Bear score: 0–4 points. One point for each layer voting bearish.
Signal fires when: The score meets or exceeds the configured minimum (default: 3 of 4), the ADX filter confirms a trending market, and the session filter confirms active market hours.
Score thresholds and what they mean:
The confluence score is printed directly on the signal label (e.g., 3/4 or 4/4) so you know at a glance exactly how strong every setup is at the moment it fires. The dashboard continuously displays the live bull and bear scores — even between signals — so you can watch confidence building in real time before the signal appears.
Edge triggering: Signals only fire on the bar where the score first crosses the threshold — not on every bar the score remains above it. This prevents signal spam during extended trend runs and ensures every triangle on the chart represents a distinct, fresh entry event.
━━━━━━━━━━━━━━━━━━━━━━━━━━━━━━━━━━━━━━━━
🛡 ADX Filter — Trend Quality Gate
Before any signal reaches the chart, it must also pass the ADX (Average Directional Index) filter. ADX measures the strength of the current trend regardless of direction — a reading below the threshold indicates a choppy, ranging market where trend-following signals have low reliability.
Default threshold: 20. When ADX is below this level, all signals are suppressed — even if the confluence score is 4/4. This is the system's protection against the single most common failure mode of scalping indicators: firing confidently into sideways, oscillating price action.
The ADX value and pass/fail status are displayed live on the dashboard so you always know whether the market structure supports trading at any given moment.
━━━━━━━━━━━━━━━━━━━━━━━━━━━━━━━━━━━━━━━━
🕐 Session Filter — Active Hours Gate
The Session Filter</b> restricts signals to a configurable active trading window (default: 07:00–20:00 exchange time). Outside this window, signals are suppressed regardless of confluence score.
Why this matters for scalpers: Low-volume pre-market and post-market hours produce the most misleading signals of any period. Spreads widen, liquidity thins, and momentum moves that look compelling on the chart are frequently reversed the moment the main session opens. The session filter eliminates this entire class of false setups automatically.
The dashboard displays a clear ✓ ACTIVE or ✗ OFF-HOURS status so you always know whether the filter is open or closed.
━━━━━━━━━━━━━━━━━━━━━━━━━━━━━━━━━━━━━━━━
🎯 Dynamic ATR Exit System
AlphaX Pulse Scalper uses a fully dynamic ATR-based exit system with three simultaneously active exit mechanisms — each serving a distinct role in protecting profit.
Stop Loss: Fixed at entry based on the pivot low (bull) or pivot high (bear) minus an ATR buffer (default: 1.2× ATR). Displayed as a solid red line below price for longs, above for shorts. This is your maximum risk boundary — it does not move.
TP1 — Partial Target (50%): Set at 1.8× ATR from entry. When price reaches TP1, scale out 50% of the position and let the remainder run to TP2. A small circle marker appears at the TP1 bar.
TP2 — Full Target: Set at 3.5× ATR from entry. When price reaches TP2, the full position exits and the system resets. A labeled TP marker appears on the chart.
ATR Trailing Stop: The most important of the three. From the moment a trade opens, a trailing stop moves dynamically with price — always positioned 1.5× ATR behind the current bar's low (for longs) or high (for shorts). The trail is displayed as a live orange line on the chart. As price advances in your favor, the trail advances with it. If price reverses and hits the trail before reaching TP2, the trade exits at the trail level rather than waiting to give back all gains.
Why the trailing stop changes everything: Fixed TP levels work in textbook trends. In the real market, strong impulses often exceed TP2 before reversing — and weak impulses stall before even reaching TP1. The ATR trailing stop captures whatever the market gives, without predetermining a ceiling on your profit. In strong trending conditions, a single Pulse Scalper signal with an active trail can run 5–10× ATR before stopping out.
All three exit levels — SL, TP1, TP2, and the trailing stop — are plotted as live lines on the chart as long as a trade is active, then cleared automatically when the position closes.
━━━━━━━━━━━━━━━━━━━━━━━━━━━━━━━━━━━━━━━━
📊 Live Dashboard
The real-time dashboard displays the complete internal state of the indicator across four sections, updated on every bar.
MARKET
CONFLUENCE
POSITION
INFO
━━━━━━━━━━━━━━━━━━━━━━━━━━━━━━━━━━━━━━━━
📈 Chart Visual System
Every visual element on the chart serves a specific purpose. There is no decorative clutter.
━━━━━━━━━━━━━━━━━━━━━━━━━━━━━━━━━━━━━━━━
🚀 How to Trade with AlphaX Pulse Scalper — Step by Step
Step 1 — Check the Dashboard Before Every Session
Step 2 — Watch the Confluence Scores Build
Step 3 — Enter on the Signal Triangle
Step 4 — Manage with the Live Exit Lines
Step 5 — Exit and Reset
━━━━━━━━━━━━━━━━━━━━━━━━━━━━━━━━━━━━━━━━
⚠ Identifying Low-Quality Conditions — When Not to Trade
The system is designed to filter out most low-quality conditions automatically. But understanding what to look for gives you an additional edge.
Stand aside when you see:
What to do:
━━━━━━━━━━━━━━━━━━━━━━━━━━━━━━━━━━━━━━━━
⚡ Key Features
━━━━━━━━━━━━━━━━━━━━━━━━━━━━━━━━━━━━━━━━
⚙ Settings Reference
EMA Ribbon
Squeeze Momentum
Volume Delta
VWAP
Confluence Gate
ADX Filter
Exit Settings
Display
Colors
━━━━━━━━━━━━━━━━━━━━━━━━━━━━━━━━━━━━━━━━
🔔 Alert Conditions (9 total)
Entry Alerts
Exit Alerts
Special State Alerts
All alert messages include {{ticker}} and {{interval}} for clean webhook and notification integration.
━━━━━━━━━━━━━━━━━━━━━━━━━━━━━━━━━━━━━━━━
🎯 Recommended Settings by Instrument & Timeframe
The default configuration is optimized for XAUUSD, major forex pairs, and crypto on M1–M5:
For other instruments or timeframes, adjust:
━━━━━━━━━━━━━━━━━━━━━━━━━━━━━━━━━━━━━━━━
👥 Who This Is For
━━━━━━━━━━━━━━━━━━━━━━━━━━━━━━━━━━━━━━━━
📝 Notes
━━━━━━━━━━━━━━━━━━━━━━━━━━━━━━━━━━━━━━━━
⚠ Disclaimer
This indicator is a technical analysis and visualization tool intended for educational and informational purposes only. It does not constitute financial advice or a recommendation to buy or sell any financial instrument. All signals are generated from historical and real-time price data using mathematical calculations — their accuracy or profitability is not guaranteed. Past performance of any signal type does not guarantee future results. Always conduct your own analysis, use proper risk management, and consult a licensed financial advisor before making any trading decisions. The author accepts no responsibility for any losses incurred from the use of this indicator.
━━━━━━━━━━━━━━━━━━━━━━━━━━━━━━━━━━━━━━━━
Built for scalpers who need more than a signal — a complete system that scores, filters, enters, trails, and exits with precision on every trade.
AlphaX Pulse Scalper is a professional-grade multi-confluence scalping system engineered to fire only when four independent technical engines simultaneously agree on direction. Unlike single-indicator systems that generate signals from one source of information, Pulse Scalper runs a live scoring gate across an EMA Ribbon, a Squeeze Momentum engine, a Volume Delta pressure model, and a VWAP Deviation filter — every bar, on every candle. A signal only reaches your chart when at least three of the four layers confirm. The result is a dramatically lower signal count with a dramatically higher average quality per signal. Designed for active scalpers on crypto, forex, gold, and indices across the 1-minute to 15-minute timeframes.
━━━━━━━━━━━━━━━━━━━━━━━━━━━━━━━━━━━━━━━━
🔬 The 4-Layer Confluence Engine — How It Works
Most scalping indicators fire from a single calculation — a crossover, a threshold breach, a momentum flip. The problem is that any single calculation is easily fooled by noise, spikes, and choppy price action. AlphaX Pulse Scalper is built on a fundamentally different architecture: four completely independent layers, each measuring a different dimension of market behavior, each casting a vote on every bar. Only when enough votes align does a signal fire.
This is not a filter applied on top of a signal. The confluence is the signal.
━━━━━━━━━━━━━━━━━━━━━━━━━━━━━━━━━━━━━━━━
📐 Layer 1 — EMA Ribbon (Trend Structure)
The first layer is a triple EMA ribbon using a Fast EMA (default: 8), Slow EMA (default: 21), and Signal EMA (default: 50). This layer answers a single question: is the market in a clean, structured trend right now?
Bull condition: Fast EMA above Slow EMA, Slow EMA above Signal EMA, and price closing above all three — a full stack alignment confirming upward momentum structure.
Bear condition: The full inverse — Fast below Slow below Signal, with price below all three.
Why this matters: The ribbon does not react to a single crossover. All three EMAs must be stacked in order and price must be on the correct side. This eliminates the vast majority of false crossover signals that plague simple dual-EMA systems. The ribbon is also plotted directly on the chart as a gradient-filled channel — bull fills in yellow-green, bear fills in red — giving you immediate structural context at a glance.
━━━━━━━━━━━━━━━━━━━━━━━━━━━━━━━━━━━━━━━━
⚡ Layer 2 — Squeeze Momentum (Energy Detection)
The second layer is built on the TTM Squeeze principle — one of the most reliable pre-breakout detection systems in technical analysis. It works by measuring the relationship between two volatility envelopes: Bollinger Bands and Keltner Channels.
Squeeze state: When the Bollinger Bands compress inside the Keltner Channels, the market is coiling — volatility has contracted and energy is building. These periods of compression historically precede the strongest directional moves. The squeeze state is displayed as a subtle orange background tint on the chart, and flagged on the dashboard as ⚡ BUILDING — giving you advance warning that a breakout is loading before it happens.
Momentum direction: The raw momentum value is calculated using a linear regression of price position relative to the midpoint of the recent high-low range. When this value is positive and rising, the squeeze is releasing to the upside. When negative and falling, it is releasing to the downside.
Layer 2 votes bull when: Momentum value is above zero and accelerating upward.
Layer 2 votes bear when: Momentum value is below zero and accelerating downward.
Why this matters: This layer catches the energy behind a move, not just the direction. A breakout with strong squeeze momentum behind it is fundamentally different from a breakout on low momentum — and this layer distinguishes between the two on every bar.
━━━━━━━━━━━━━━━━━━━━━━━━━━━━━━━━━━━━━━━━
📊 Layer 3 — Volume Delta (Institutional Pressure)
The third layer is a proprietary volume delta model that estimates the real buying and selling pressure behind each candle — without requiring exchange-level order flow data.
How it works: Each candle's volume is split into bullish and bearish components based on the candle's close position within its high-low range. A candle closing near its high attributes most of its volume to buyers; a candle closing near its low attributes most to sellers. These estimates are smoothed using an EMA to eliminate single-bar noise. A secondary OBV slope (On-Balance Volume) is calculated over the configured lookback and used as an independent confirmation of the dominant pressure direction.
Layer 3 votes bull when: The bull volume EMA exceeds the bear volume EMA, the delta EMA is positive, and the OBV slope is rising — all three volume signals agree on buying pressure.
Layer 3 votes bear when: The full inverse — bear volume dominates, delta EMA is negative, OBV slope is falling.
Why this matters: Price can move in any direction on any bar. Volume delta tells you whether real capital is flowing in the direction of that move. A price breakout accompanied by genuine volume pressure is a high-confidence breakout. A price breakout on weak or opposing volume is a trap. This layer is the system's protection against price manipulation and false breakouts.
━━━━━━━━━━━━━━━━━━━━━━━━━━━━━━━━━━━━━━━━
📡 Layer 4 — VWAP Deviation (Institutional Bias)
The fourth layer uses the Volume Weighted Average Price (VWAP) with dynamically calculated standard deviation bands to identify where price stands relative to institutional value.
Band structure: Two band pairs are calculated — ±1σ and ±2σ — using a volume-weighted standard deviation formula applied across the session. These bands represent statistically significant deviations from the session's fair value anchor.
Layer 4 votes bull when: Price is above VWAP (institutional bias is bullish) but has not yet extended beyond the +2σ band — confirming trend direction without chasing a stretched, overextended move.
Layer 4 votes bear when: Price is below VWAP but has not extended beyond the -2σ band.
Why this matters: VWAP is the single most widely watched intraday reference level used by institutional desks, market makers, and algorithms. Price above VWAP means institutions are net buyers for the session. Price below means net sellers. The 2σ filter prevents the system from entering during climactic exhaustion moves — precisely the moments when reversal risk is highest and reward is lowest.
The bands are plotted directly on the chart — VWAP as a purple line, ±1σ as dotted yellow-green and red circles, ±2σ as solid outer boundaries — so you always have the full VWAP context visible alongside your signals.
━━━━━━━━━━━━━━━━━━━━━━━━━━━━━━━━━━━━━━━━
🧠 The Confluence Gate — Live Scoring System
On every bar, each of the four layers independently casts its vote. The results are tallied into a live confluence score displayed in real time on the dashboard.
Bull score: 0–4 points. One point for each layer voting bullish.
Bear score: 0–4 points. One point for each layer voting bearish.
Signal fires when: The score meets or exceeds the configured minimum (default: 3 of 4), the ADX filter confirms a trending market, and the session filter confirms active market hours.
Score thresholds and what they mean:
- 4 / 4 — maximum confluence. All four independent engines agree. The highest-conviction setup the system can produce. Enter full size.
- 3 / 4 — strong confluence. Three of four layers aligned. The default threshold — high quality with reasonable frequency.
- 2 / 4 — weak confluence. Available if you lower the minimum, but not recommended. Two engines agreeing is not meaningful convergence.
The confluence score is printed directly on the signal label (e.g., 3/4 or 4/4) so you know at a glance exactly how strong every setup is at the moment it fires. The dashboard continuously displays the live bull and bear scores — even between signals — so you can watch confidence building in real time before the signal appears.
Edge triggering: Signals only fire on the bar where the score first crosses the threshold — not on every bar the score remains above it. This prevents signal spam during extended trend runs and ensures every triangle on the chart represents a distinct, fresh entry event.
━━━━━━━━━━━━━━━━━━━━━━━━━━━━━━━━━━━━━━━━
🛡 ADX Filter — Trend Quality Gate
Before any signal reaches the chart, it must also pass the ADX (Average Directional Index) filter. ADX measures the strength of the current trend regardless of direction — a reading below the threshold indicates a choppy, ranging market where trend-following signals have low reliability.
Default threshold: 20. When ADX is below this level, all signals are suppressed — even if the confluence score is 4/4. This is the system's protection against the single most common failure mode of scalping indicators: firing confidently into sideways, oscillating price action.
The ADX value and pass/fail status are displayed live on the dashboard so you always know whether the market structure supports trading at any given moment.
━━━━━━━━━━━━━━━━━━━━━━━━━━━━━━━━━━━━━━━━
🕐 Session Filter — Active Hours Gate
The Session Filter</b> restricts signals to a configurable active trading window (default: 07:00–20:00 exchange time). Outside this window, signals are suppressed regardless of confluence score.
Why this matters for scalpers: Low-volume pre-market and post-market hours produce the most misleading signals of any period. Spreads widen, liquidity thins, and momentum moves that look compelling on the chart are frequently reversed the moment the main session opens. The session filter eliminates this entire class of false setups automatically.
The dashboard displays a clear ✓ ACTIVE or ✗ OFF-HOURS status so you always know whether the filter is open or closed.
━━━━━━━━━━━━━━━━━━━━━━━━━━━━━━━━━━━━━━━━
🎯 Dynamic ATR Exit System
AlphaX Pulse Scalper uses a fully dynamic ATR-based exit system with three simultaneously active exit mechanisms — each serving a distinct role in protecting profit.
Stop Loss: Fixed at entry based on the pivot low (bull) or pivot high (bear) minus an ATR buffer (default: 1.2× ATR). Displayed as a solid red line below price for longs, above for shorts. This is your maximum risk boundary — it does not move.
TP1 — Partial Target (50%): Set at 1.8× ATR from entry. When price reaches TP1, scale out 50% of the position and let the remainder run to TP2. A small circle marker appears at the TP1 bar.
TP2 — Full Target: Set at 3.5× ATR from entry. When price reaches TP2, the full position exits and the system resets. A labeled TP marker appears on the chart.
ATR Trailing Stop: The most important of the three. From the moment a trade opens, a trailing stop moves dynamically with price — always positioned 1.5× ATR behind the current bar's low (for longs) or high (for shorts). The trail is displayed as a live orange line on the chart. As price advances in your favor, the trail advances with it. If price reverses and hits the trail before reaching TP2, the trade exits at the trail level rather than waiting to give back all gains.
Why the trailing stop changes everything: Fixed TP levels work in textbook trends. In the real market, strong impulses often exceed TP2 before reversing — and weak impulses stall before even reaching TP1. The ATR trailing stop captures whatever the market gives, without predetermining a ceiling on your profit. In strong trending conditions, a single Pulse Scalper signal with an active trail can run 5–10× ATR before stopping out.
All three exit levels — SL, TP1, TP2, and the trailing stop — are plotted as live lines on the chart as long as a trade is active, then cleared automatically when the position closes.
━━━━━━━━━━━━━━━━━━━━━━━━━━━━━━━━━━━━━━━━
📊 Live Dashboard
The real-time dashboard displays the complete internal state of the indicator across four sections, updated on every bar.
MARKET
- Session — ✓ ACTIVE or ✗ OFF-HOURS. Confirms whether the session filter is open for signals
- ADX — live ADX value with ✓ or ✗ pass/fail indicator. Confirms whether market structure is trending strongly enough to trade
CONFLUENCE
- L1 EMA Ribbon — current ribbon state: ▲ BULL, ▼ BEAR, or — FLAT
- L2 Squeeze Momentum — current momentum state: ⚡ SQUEEZE (building), ▲ BULL, ▼ BEAR, or — FLAT. The squeeze state is the highest-value pre-signal condition the system can display
- L3 Volume Delta — current volume pressure: ▲ BULL, ▼ BEAR, or — NEUTRAL
- L4 VWAP Deviation — current VWAP position: ▲ ABOVE, ▼ BELOW, or — EXTENDED (price beyond 2σ, filter active)
- Bull Score — live 0–4 score for bullish confluence. Background turns yellow-green when threshold is met — the signal is ready to fire
- Bear Score — live 0–4 score for bearish confluence. Background turns red when threshold is met
POSITION
- Position — current tracked position: ▲ LONG, ▼ SHORT, or — FLAT with background color highlight
- Stop Loss — the fixed SL level currently active, color-coded red (bull) or green (bear)
- Trail Stop — the current trailing stop level in orange — updates dynamically every bar the trade is open
- TP1 (50%) — the first take-profit target currently active
- TP2 (full) — the full exit target currently active
- Bars in Trade — how many bars the current position has been open
INFO
- ATR — current ATR value used for all exit calculations
- VWAP — current VWAP price level for the session
- Squeeze — ⚡ BUILDING when BB is inside KC (squeeze active), or — RELEASED when the squeeze has fired
━━━━━━━━━━━━━━━━━━━━━━━━━━━━━━━━━━━━━━━━
📈 Chart Visual System
Every visual element on the chart serves a specific purpose. There is no decorative clutter.
- ▲ Triangle (below bar) — bull entry signal. Fires when bull confluence score meets threshold, ADX passes, session is active
- ▼ Triangle (above bar) — bear entry signal. Fires when bear confluence score meets threshold
- Score Label (3/4 or 4/4) — printed beside each signal triangle. The raw confluence count at signal time
- EMA Ribbon Fill — yellow-green fill between Fast and Slow EMA during bull structure, red during bear structure. Collapses to gray during neutral
- VWAP Line — purple center line marking the session's volume-weighted fair value
- VWAP ±1σ Bands — dotted yellow-green and red circles marking the first standard deviation
- VWAP ±2σ Bands — solid outer boundaries. Price touching these is the maximum extension zone
- Orange Squeeze Background — appears during active squeeze conditions. A visual alert that energy is compressing and a breakout is approaching
- Yellow-green background tint — active during open long trades. Confirms trade is live at a glance
- Red background tint — active during open short trades
- SL Line (red/green) — the fixed stop loss level, active while trade is open
- TP1 Line (semi-transparent) — the partial target level
- TP2 Line (bright) — the full exit target level
- Trail Line (orange) — the dynamic trailing stop, moves with price every bar
- TP marker — appears when TP2 is hit. Full exit confirmed
- SL marker — appears when stop loss or trailing stop is triggered
━━━━━━━━━━━━━━━━━━━━━━━━━━━━━━━━━━━━━━━━
🚀 How to Trade with AlphaX Pulse Scalper — Step by Step
Step 1 — Check the Dashboard Before Every Session
- Confirm Session shows ✓ ACTIVE
- Confirm ADX shows ✓ — if ADX is below threshold, the market is ranging and no signals will fire regardless of how the layers look
- Watch the Squeeze row on the dashboard — ⚡ BUILDING means a breakout setup is forming. This is your highest-alert pre-signal state
Step 2 — Watch the Confluence Scores Build
- Monitor the live Bull Score and Bear Score rows in the dashboard. You can watch the scores build in real time, bar by bar, before a signal fires
- When a score reaches 3/4 and the background highlights, a signal is imminent or has just fired
- A 4/4 score is the highest-quality setup. Prioritize these above all else
Step 3 — Enter on the Signal Triangle
- A ▲ triangle below the bar is a long signal. Enter on the close of the signal bar or the open of the next bar
- A ▼ triangle above the bar is a short signal. Enter on the same basis
- Read the score label — 4/4 signals warrant full position size, 3/4 signals warrant standard or slightly reduced size
Step 4 — Manage with the Live Exit Lines
- The SL line is your hard stop. Never move it further away from price
- Watch the orange Trail Stop line advance with price as the trade moves in your favor
- At TP1, scale out 50% of the position. Move your manual stop to breakeven on the remainder
- Let the trailing stop manage the rest — it will exit automatically when momentum exhausts
Step 5 — Exit and Reset
- A TP marker on the chart confirms TP2 has been hit. Full exit. Dashboard resets to — FLAT
- An SL marker confirms the stop or trail has been hit. Accept the loss and wait for the next setup
- After any exit, do not re-enter immediately. Wait for the confluence score to rebuild from zero — this prevents revenge trading into the same noise that stopped you out
━━━━━━━━━━━━━━━━━━━━━━━━━━━━━━━━━━━━━━━━
⚠ Identifying Low-Quality Conditions — When Not to Trade
The system is designed to filter out most low-quality conditions automatically. But understanding what to look for gives you an additional edge.
Stand aside when you see:
- ADX ✗ on the dashboard — the market is not trending. Any signal would be a range-bound trade against the system's core design
- Dashboard shows — FLAT across all four layers — no layer has a directional conviction. The market has no readable bias
- Bull and bear scores both at 1 or 2 — the layers are split. Price is oscillating without commitment in either direction
- Session shows ✗ OFF-HOURS — no signals will fire and manual entries carry elevated risk from thin liquidity
- Squeeze just released but score is only 2/4 — the squeeze fired but not enough layers confirmed the direction. This is a low-conviction breakout — wait for the next setup
- Rapid alternation of ▲ and ▼ triangles — if you see signals in both directions within a short window, the market is too choppy. Increase the ADX threshold in settings or stand aside until a clearer trend develops
What to do:
- Wait for the Squeeze dashboard to show ⚡ BUILDING — this is the highest-quality pre-signal state. The best Pulse Scalper setups almost always begin with a squeeze
- Wait for ADX to climb back above threshold — a strong trend is forming
- Wait for a 4/4 score on the next signal — maximum confluence only, no compromises in a difficult session
━━━━━━━━━━━━━━━━━━━━━━━━━━━━━━━━━━━━━━━━
⚡ Key Features
- 🔬 4-layer confluence gate — EMA Ribbon, Squeeze Momentum, Volume Delta, and VWAP Deviation must agree before any signal fires
- 📊 Live confluence scoring — bull and bear scores update every bar in real time, displayed on the dashboard before the signal appears
- ⚡ TTM Squeeze detection — Bollinger/Keltner compression identifies pre-breakout coiling with an orange background tint and dashboard flag
- 📈 Proprietary volume delta model — estimates buying and selling pressure without exchange-level order flow data, confirmed by OBV slope
- 📡 VWAP with standard deviation bands — ±1σ and ±2σ plotted live, VWAP filter prevents entries during climactic extension moves
- 🛡 ADX trend quality gate — suppresses all signals during choppy, non-trending market conditions
- 🕐 Session filter — restricts signals to active market hours, eliminating low-liquidity false setups automatically
- 🎯 Triple exit mechanism — fixed ATR stop loss, TP1 at 1.8× ATR, TP2 at 3.5× ATR, plus dynamic ATR trailing stop that advances with price every bar
- 📉 ATR trailing stop — plotted as a live orange line, adapts dynamically to volatility, captures extended runs beyond TP2 in strong trends
- 🏷 Confluence score label on every signal — 3/4 or 4/4 printed directly on the chart so you know signal quality at a glance
- 📊 28-row live dashboard — Market, Confluence, Position, and Info sections updated in real time
- 🔔 9 alert conditions — bull entry, bear entry, TP1/TP2 hits, stop hits, squeeze start, any exit
- 🎨 Cohesive dual-tone color theme — yellow-green for all bullish elements, red for all bearish elements, orange for squeeze and trail, gray for neutral
- ⚙ Fully configurable — all EMA periods, squeeze parameters, VWAP multipliers, ADX threshold, confluence minimum, ATR multipliers, session window, and all colors are adjustable from the settings panel
━━━━━━━━━━━━━━━━━━━━━━━━━━━━━━━━━━━━━━━━
⚙ Settings Reference
EMA Ribbon
- Fast EMA — the fastest ribbon line, reacts most immediately to price (default: 8)
- Slow EMA — the intermediate ribbon line (default: 21)
- Signal EMA — the macro trend anchor. All three must stack in order for a ribbon vote (default: 50)
- Show EMA Ribbon — toggle the ribbon fill and lines on or off
Squeeze Momentum
- BB Length — Bollinger Band lookback period for squeeze detection (default: 20)
- BB Mult — Bollinger Band standard deviation multiplier (default: 2.0)
- KC Length — Keltner Channel lookback period (default: 20)
- KC Mult — Keltner Channel ATR multiplier (default: 1.5)
- Momentum Length — linear regression period for the momentum value calculation (default: 12)
Volume Delta
- Volume MA Length — EMA smoothing period for bull and bear volume estimates (default: 14)
- OBV Slope Length — lookback bars for OBV slope calculation (default: 10)
VWAP
- Use VWAP Filter — when enabled, Layer 4 requires price to be on the correct side of VWAP (default: on)
- Show VWAP Bands — toggle ±1σ and ±2σ band plots on or off
- Band 1 Mult — first standard deviation band multiplier (default: 1.0)
- Band 2 Mult — second standard deviation band multiplier (default: 2.0)
Confluence Gate
- Min Layers Required — how many of the 4 layers must agree for a signal to fire. 2 = more signals, 3 = balanced (default), 4 = ultra-selective
- Session Filter — toggle the active hours restriction on or off
- Active Session — configurable session window string (default: 0700-2000)
ADX Filter
- Use ADX Filter — toggle the trend quality gate on or off
- ADX Length — lookback period for ADX calculation (default: 14)
- ADX Minimum — threshold below which all signals are suppressed (default: 20)
Exit Settings
- ATR Length — lookback period for ATR used in all exit calculations (default: 10)
- SL ATR Mult — stop loss distance from entry as a multiple of ATR (default: 1.2)
- TP1 ATR Mult — first take-profit distance (default: 1.8 — approximately 1.5:1 reward on a full position)
- TP2 ATR Mult — full exit target distance (default: 3.5 — approximately 3:1 reward)
- Use ATR Trailing Stop — toggle the dynamic trailing stop mechanism on or off
- Trail ATR Mult — trailing stop distance from current bar's low or high (default: 1.5)
- Show Exit Levels — toggle SL, TP1, TP2, and trail lines on the chart
Display
- Show Confluence Score Label — prints the live score (e.g. 3/4) on every signal triangle
- Show Dashboard — toggle the entire dashboard panel on or off
- Dashboard Position — Top Left / Top Right / Bottom Left / Bottom Right
Colors
- Bull / Bull Bright — yellow-green family for all bullish signals, fills, and labels
- Bear / Bear Bright — red family for all bearish signals, fills, and labels
- Squeeze — orange used for squeeze background tint and trailing stop line
- Neutral — gray for inactive states and neutral dashboard rows
- Text Light / Dash BG — dashboard typography and background
━━━━━━━━━━━━━━━━━━━━━━━━━━━━━━━━━━━━━━━━
🔔 Alert Conditions (9 total)
Entry Alerts
- Bull Confluence Entry — bull score meets threshold, ADX passes, session active
- Bear Confluence Entry — bear score meets threshold, ADX passes, session active
Exit Alerts
- Bull TP1 Hit — price reaches the first bull take-profit level
- Bull TP2 Hit — price reaches the full bull exit target
- Bull Stop Hit — stop loss or trailing stop triggered on a long position
- Bear TP1 Hit — price reaches the first bear take-profit level
- Bear TP2 Hit — price reaches the full bear exit target
- Bear Stop Hit — stop loss or trailing stop triggered on a short position
Special State Alerts
- Squeeze Started — Bollinger Bands have compressed inside Keltner Channels. A breakout setup is loading
All alert messages include {{ticker}} and {{interval}} for clean webhook and notification integration.
━━━━━━━━━━━━━━━━━━━━━━━━━━━━━━━━━━━━━━━━
🎯 Recommended Settings by Instrument & Timeframe
The default configuration is optimized for XAUUSD, major forex pairs, and crypto on M1–M5:
- Min Layers at 3/4 — strong confluence without requiring perfection on every bar
- ADX minimum at 20 — filters choppy intraday sessions without being overly restrictive
- ATR Trail at 1.5× — gives trades enough room to breathe on fast-moving scalping timeframes
- Session 07:00–20:00 — covers London and New York sessions, the highest-volume windows for forex and gold
For other instruments or timeframes, adjust:
- Higher timeframes (M15, H1, H4) — increase EMA periods (Fast 13, Slow 34, Signal 89), increase ADX minimum to 25, increase TP2 to 4.5–5.0× ATR
- Crypto (BTC, ETH) — increase KC Mult to 2.0–2.5 to accommodate wider volatility, increase SL mult to 1.5–2.0
- Indices (NAS100, US30, SPX500) — use defaults with ADX raised to 22–25. Index trends are strong but session timing is critical — tighten session window to 09:30–16:00 for US indices
- More signals — lower Min Layers to 2, disable ADX filter, widen session window
- Fewer, higher-quality signals — raise Min Layers to 4, raise ADX minimum to 25, enable volume filter with ratio at 1.2×
━━━━━━━━━━━━━━━━━━━━━━━━━━━━━━━━━━━━━━━━
👥 Who This Is For
- ⚡ Scalpers and intraday momentum traders — the 1m–15m timeframe focus and ATR trailing exit system are built specifically for fast-moving intraday conditions
- 🥇 Gold (XAUUSD) and forex traders — default settings are tuned and tested on gold and major pairs during London and New York sessions
- 📊 Crypto and index traders — the four-layer architecture adapts across instruments without manual recalibration
- 🧠 Systematic traders — the live confluence score provides a quantitative signal quality reading, not just a visual arrow
- 📈 Traders who want to eliminate overtrading — the confluence gate, ADX filter, session filter, and edge triggering physically prevent low-quality setups from appearing on the chart
- 🎯 Traders who struggle with exits — the three-layer exit system (fixed SL, scaled TP1, trailing TP2) provides a complete, rules-based exit framework that removes emotion from trade management
- 📉 Risk-conscious traders — every trade has a defined stop, a defined first target, and a dynamic trailing mechanism. There is no ambiguity about where you exit under any scenario
━━━━━━━━━━━━━━━━━━━━━━━━━━━━━━━━━━━━━━━━
📝 Notes
- All signals are confirmed on bar close — the indicator is non-repainting by design
- The edge-triggered signal logic means each triangle on the chart represents a distinct new confluence event — the same setup does not generate repeated signals during extended runs
- The trailing stop line on the chart is a real-time visual — it moves every bar the trade is open and accurately reflects the current stop level at all times
- Maximum 500 labels and 500 lines are used — on very low timeframes with extended chart history, the oldest markers may be automatically removed by TradingView's rendering limits
- The Squeeze background tint is a leading indicator — it appears before signals fire, giving you time to prepare. The strongest Pulse Scalper signals frequently begin with a squeeze
- The VWAP calculation resets at the start of each session. On instruments without a defined session (perpetual crypto), the VWAP anchors to the chart's visible history. For best results on crypto, use a 24-hour session string or disable the VWAP filter and use the other three layers
- The Trade Status section on the dashboard tracks position direction from signal to exit within a single chart session — it does not connect to your broker or brokerage account
━━━━━━━━━━━━━━━━━━━━━━━━━━━━━━━━━━━━━━━━
⚠ Disclaimer
This indicator is a technical analysis and visualization tool intended for educational and informational purposes only. It does not constitute financial advice or a recommendation to buy or sell any financial instrument. All signals are generated from historical and real-time price data using mathematical calculations — their accuracy or profitability is not guaranteed. Past performance of any signal type does not guarantee future results. Always conduct your own analysis, use proper risk management, and consult a licensed financial advisor before making any trading decisions. The author accepts no responsibility for any losses incurred from the use of this indicator.
━━━━━━━━━━━━━━━━━━━━━━━━━━━━━━━━━━━━━━━━
Built for scalpers who need more than a signal — a complete system that scores, filters, enters, trails, and exits with precision on every trade.
オープンソーススクリプト
TradingViewの精神に則り、このスクリプトの作者はコードをオープンソースとして公開してくれました。トレーダーが内容を確認・検証できるようにという配慮です。作者に拍手を送りましょう!無料で利用できますが、コードの再公開はハウスルールに従う必要があります。

🌐 alphax.trading
Institutional Grade Signals --> Engineered for Retail
💎ᴠɪᴘ tradingview.com/v/TaXohZvb/
[ A L P H A X ] PRIME - Premium Signal Engine
🔢 alphax.trading/resources/calculators
AlphaX Calculators
Institutional Grade Signals --> Engineered for Retail
💎ᴠɪᴘ tradingview.com/v/TaXohZvb/
[ A L P H A X ] PRIME - Premium Signal Engine
🔢 alphax.trading/resources/calculators
AlphaX Calculators
免責事項
これらの情報および投稿は、TradingViewが提供または承認する金融、投資、取引、またはその他の種類の助言もしくは推奨であることを意図したものではなく、またこれらに該当するものでもありません。詳細は利用規約をご覧ください。
オープンソーススクリプト
TradingViewの精神に則り、このスクリプトの作者はコードをオープンソースとして公開してくれました。トレーダーが内容を確認・検証できるようにという配慮です。作者に拍手を送りましょう!無料で利用できますが、コードの再公開はハウスルールに従う必要があります。
🌐 alphax.trading
Institutional Grade Signals --> Engineered for Retail
💎ᴠɪᴘ tradingview.com/v/TaXohZvb/
[ A L P H A X ] PRIME - Premium Signal Engine
🔢 alphax.trading/resources/calculators
AlphaX Calculators
Institutional Grade Signals --> Engineered for Retail
💎ᴠɪᴘ tradingview.com/v/TaXohZvb/
[ A L P H A X ] PRIME - Premium Signal Engine
🔢 alphax.trading/resources/calculators
AlphaX Calculators
免責事項
これらの情報および投稿は、TradingViewが提供または承認する金融、投資、取引、またはその他の種類の助言もしくは推奨であることを意図したものではなく、またこれらに該当するものでもありません。詳細は利用規約をご覧ください。