OPEN-SOURCE SCRIPT
Financial Repression Oscillator
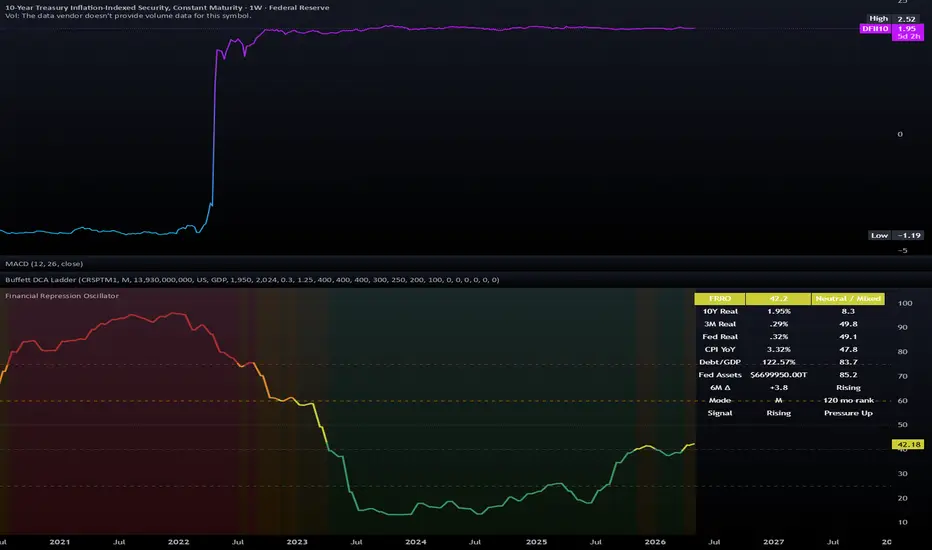
The Financial Repression Oscillator is a macro-regime indicator designed to help visualize whether current conditions are more consistent with a restrictive real-rate environment or a financial-repression-like environment.
It combines several public FRED macroeconomic series into a single bounded oscillator from 0 to 100. The goal is not to generate trade signals, but to provide a compact way to monitor real rates, inflation pressure, debt burden, and Federal Reserve balance-sheet conditions together.
Why this can be useful
Macro conditions can change the meaning of “safe” assets.
When real rates are positive, cash-like instruments and short-duration fixed income may offer meaningful real returns. When real rates are negative or falling while inflation and debt pressure remain elevated, cash and nominal fixed-income assets may lose purchasing power in real terms.
This indicator is intended to make those regime conditions easier to monitor in one place.
General interpretation
0-25 Restrictive / not repressive
25-40 Mildly restrictive
40-60 Neutral / mixed
60-75 Repression-like
75-100 Strongly repression-like
These zones are intended as a framework for macro context, not as automatic buy or sell signals.
What the indicator tracks
The oscillator uses six components:
1. 10-Year Real Yield
Series: FRED:DFII10
This is the 10-year Treasury Inflation-Protected Securities real yield. It is used as a market-based measure of long-term real interest rates.
Higher positive real yields generally suggest a more restrictive real-rate environment. Lower or negative real yields are more consistent with financial-repression-like conditions.
2. 3-Month Real Rate
Series: FRED:DTB3 minus CPI YoY
This compares the 3-month Treasury bill yield to year-over-year CPI inflation.
It helps show whether short-term cash-like instruments are providing a positive or negative real return relative to inflation.
3. Real Fed Funds Rate
Series: FRED:FEDFUNDS minus CPI YoY
This compares the effective federal funds rate to year-over-year CPI inflation.
It provides a simple estimate of whether short-term monetary policy is restrictive or accommodative after inflation.
4. CPI Inflation
Series: FRED:CPIAUCSL
Inflation is included because financial repression is usually most relevant when inflation is elevated relative to interest rates.
The script calculates CPI year-over-year inside the monthly data request so that the calculation remains consistent when the indicator is viewed on daily, weekly, or monthly charts.
5. Federal Debt to GDP
Series: FRED:GFDEGDQ188S
Debt to GDP is included as a structural pressure variable.
High debt levels do not prove that financial repression is occurring, but they may increase the policy incentive to maintain lower real borrowing costs over time.
6. Federal Reserve Total Assets
Series: FRED:WALCL
Federal Reserve total assets are used as a broad proxy for the size of the central bank’s balance sheet.
A larger balance sheet may indicate a greater central-bank footprint in financial markets, though it should not be interpreted by itself as proof of financial repression.
How the scoring works
The indicator uses a hybrid scoring model.
Each component is scored using two methods:
Absolute threshold scoring
Absolute thresholds are used so that the oscillator does not label an environment as strongly repressive simply because a value is low relative to recent history.
For example, a positive real rate should not automatically score as maximum financial repression just because it has declined from a recent high.
Percentile pressure scoring
A smaller percentile component compares each series to its own recent history over a 120-month window.
This helps the oscillator respond when conditions are deteriorating or improving relative to the recent macro regime.
Weighted blend
The real-rate components receive the largest weights because suppressed real yields are central to the concept of financial repression.
The debt and Federal Reserve asset components are included as structural context, but they are not intended to dominate the reading by themselves.
How to use it
This indicator is best used as a macro context tool on weekly or monthly charts.
Possible uses include:
Important limitations
This indicator is not a trading system.
It does not issue buy or sell signals, and it does not attempt to predict short-term market direction. The underlying data comes from FRED and updates at different frequencies. Some components update daily, while others update monthly or quarterly, and macroeconomic data may be revised.
The oscillator should be interpreted as a broad macro-regime estimate, not as a precise timing model.
A high debt score or a large Federal Reserve balance sheet score does not, by itself, mean financial repression is occurring. The most important readings come from the combination of real yields, inflation, short real rates, and structural debt pressure.
Practical reading
When the oscillator is low, real-rate conditions are generally more restrictive and cash-like assets may be more competitive in real terms.
When the oscillator rises, conditions may be shifting toward a more inflationary or repression-like environment, especially if real yields are falling while inflation and debt pressure remain elevated.
The most meaningful signals are usually changes in regime over time rather than any single daily reading.
It combines several public FRED macroeconomic series into a single bounded oscillator from 0 to 100. The goal is not to generate trade signals, but to provide a compact way to monitor real rates, inflation pressure, debt burden, and Federal Reserve balance-sheet conditions together.
Why this can be useful
Macro conditions can change the meaning of “safe” assets.
When real rates are positive, cash-like instruments and short-duration fixed income may offer meaningful real returns. When real rates are negative or falling while inflation and debt pressure remain elevated, cash and nominal fixed-income assets may lose purchasing power in real terms.
This indicator is intended to make those regime conditions easier to monitor in one place.
General interpretation
0-25 Restrictive / not repressive
25-40 Mildly restrictive
40-60 Neutral / mixed
60-75 Repression-like
75-100 Strongly repression-like
These zones are intended as a framework for macro context, not as automatic buy or sell signals.
What the indicator tracks
The oscillator uses six components:
1. 10-Year Real Yield
Series: FRED:DFII10
This is the 10-year Treasury Inflation-Protected Securities real yield. It is used as a market-based measure of long-term real interest rates.
Higher positive real yields generally suggest a more restrictive real-rate environment. Lower or negative real yields are more consistent with financial-repression-like conditions.
2. 3-Month Real Rate
Series: FRED:DTB3 minus CPI YoY
This compares the 3-month Treasury bill yield to year-over-year CPI inflation.
It helps show whether short-term cash-like instruments are providing a positive or negative real return relative to inflation.
3. Real Fed Funds Rate
Series: FRED:FEDFUNDS minus CPI YoY
This compares the effective federal funds rate to year-over-year CPI inflation.
It provides a simple estimate of whether short-term monetary policy is restrictive or accommodative after inflation.
4. CPI Inflation
Series: FRED:CPIAUCSL
Inflation is included because financial repression is usually most relevant when inflation is elevated relative to interest rates.
The script calculates CPI year-over-year inside the monthly data request so that the calculation remains consistent when the indicator is viewed on daily, weekly, or monthly charts.
5. Federal Debt to GDP
Series: FRED:GFDEGDQ188S
Debt to GDP is included as a structural pressure variable.
High debt levels do not prove that financial repression is occurring, but they may increase the policy incentive to maintain lower real borrowing costs over time.
6. Federal Reserve Total Assets
Series: FRED:WALCL
Federal Reserve total assets are used as a broad proxy for the size of the central bank’s balance sheet.
A larger balance sheet may indicate a greater central-bank footprint in financial markets, though it should not be interpreted by itself as proof of financial repression.
How the scoring works
The indicator uses a hybrid scoring model.
Each component is scored using two methods:
Absolute threshold scoring
Absolute thresholds are used so that the oscillator does not label an environment as strongly repressive simply because a value is low relative to recent history.
For example, a positive real rate should not automatically score as maximum financial repression just because it has declined from a recent high.
Percentile pressure scoring
A smaller percentile component compares each series to its own recent history over a 120-month window.
This helps the oscillator respond when conditions are deteriorating or improving relative to the recent macro regime.
Weighted blend
The real-rate components receive the largest weights because suppressed real yields are central to the concept of financial repression.
The debt and Federal Reserve asset components are included as structural context, but they are not intended to dominate the reading by themselves.
How to use it
This indicator is best used as a macro context tool on weekly or monthly charts.
Possible uses include:
- Monitoring whether real-rate conditions are becoming more or less restrictive
- Comparing current macro conditions to prior regimes
- Adding context to cash, bond, equity, commodity, gold, or Bitcoin allocation decisions
- Watching for transitions between cash-friendly and negative-real-rate environments
- Supplementing other macro tools such as yield curves, credit spreads, liquidity indicators, valuation metrics, and market breadth
Important limitations
This indicator is not a trading system.
It does not issue buy or sell signals, and it does not attempt to predict short-term market direction. The underlying data comes from FRED and updates at different frequencies. Some components update daily, while others update monthly or quarterly, and macroeconomic data may be revised.
The oscillator should be interpreted as a broad macro-regime estimate, not as a precise timing model.
A high debt score or a large Federal Reserve balance sheet score does not, by itself, mean financial repression is occurring. The most important readings come from the combination of real yields, inflation, short real rates, and structural debt pressure.
Practical reading
When the oscillator is low, real-rate conditions are generally more restrictive and cash-like assets may be more competitive in real terms.
When the oscillator rises, conditions may be shifting toward a more inflationary or repression-like environment, especially if real yields are falling while inflation and debt pressure remain elevated.
The most meaningful signals are usually changes in regime over time rather than any single daily reading.
オープンソーススクリプト
TradingViewの精神に則り、このスクリプトの作者はコードをオープンソースとして公開してくれました。トレーダーが内容を確認・検証できるようにという配慮です。作者に拍手を送りましょう!無料で利用できますが、コードの再公開はハウスルールに従う必要があります。

免責事項
これらの情報および投稿は、TradingViewが提供または承認する金融、投資、取引、またはその他の種類の助言もしくは推奨であることを意図したものではなく、またこれらに該当するものでもありません。詳細は利用規約をご覧ください。
オープンソーススクリプト
TradingViewの精神に則り、このスクリプトの作者はコードをオープンソースとして公開してくれました。トレーダーが内容を確認・検証できるようにという配慮です。作者に拍手を送りましょう!無料で利用できますが、コードの再公開はハウスルールに従う必要があります。
免責事項
これらの情報および投稿は、TradingViewが提供または承認する金融、投資、取引、またはその他の種類の助言もしくは推奨であることを意図したものではなく、またこれらに該当するものでもありません。詳細は利用規約をご覧ください。