ZigZag Range box
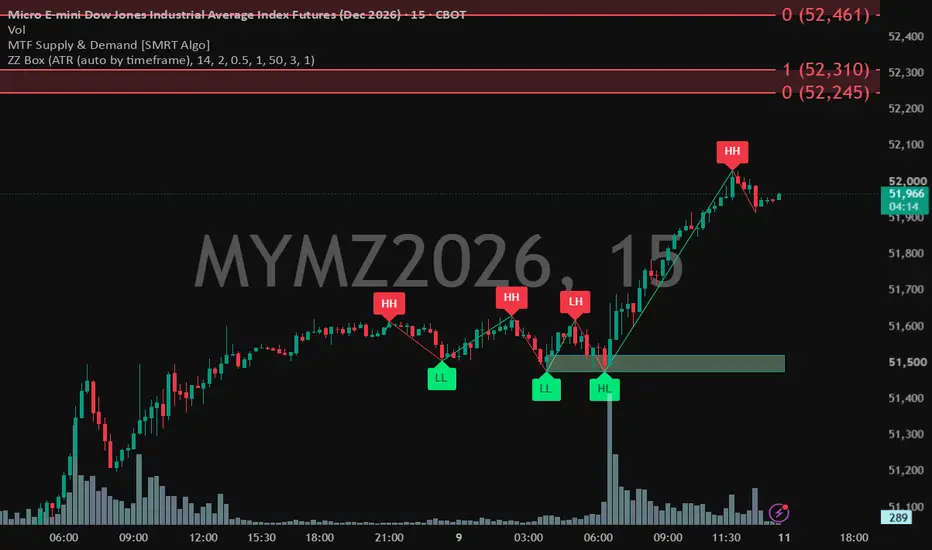
ZigZag Box Range
This indicator plots ZigZag swings and draws dynamic boxes based on the price range between swing highs and swing lows.
Main Features:
Clear ZigZag lines that highlight major swing points
Automatic range boxes between consecutive swing highs and lows
Visual representation of price structure and range
Helps identify potential support/resistance zones and market structure
Clean and lightweight design for easy chart reading
How to use:
Use the ZigZag lines to understand the current market structure (higher highs / lower lows)
The boxes show the price range of each swing, making it easier to spot consolidation zones and breakout levels
Can be used on any timeframe and any market
Feel free to adjust the ZigZag settings (deviation, depth, etc.) according to your trading style
This indicator plots ZigZag swings and draws dynamic boxes based on the price range between swing highs and swing lows.
Main Features:
Clear ZigZag lines that highlight major swing points
Automatic range boxes between consecutive swing highs and lows
Visual representation of price structure and range
Helps identify potential support/resistance zones and market structure
Clean and lightweight design for easy chart reading
How to use:
Use the ZigZag lines to understand the current market structure (higher highs / lower lows)
The boxes show the price range of each swing, making it easier to spot consolidation zones and breakout levels
Can be used on any timeframe and any market
Feel free to adjust the ZigZag settings (deviation, depth, etc.) according to your trading style

Future Trading Hub
免責事項
これらの情報および投稿は、TradingViewが提供または承認する金融、投資、取引、またはその他の種類の助言もしくは推奨であることを意図したものではなく、またこれらに該当するものでもありません。詳細は利用規約をご覧ください。
Future Trading Hub
免責事項
これらの情報および投稿は、TradingViewが提供または承認する金融、投資、取引、またはその他の種類の助言もしくは推奨であることを意図したものではなく、またこれらに該当するものでもありません。詳細は利用規約をご覧ください。