アップデート済
Key Levels and Expected Range
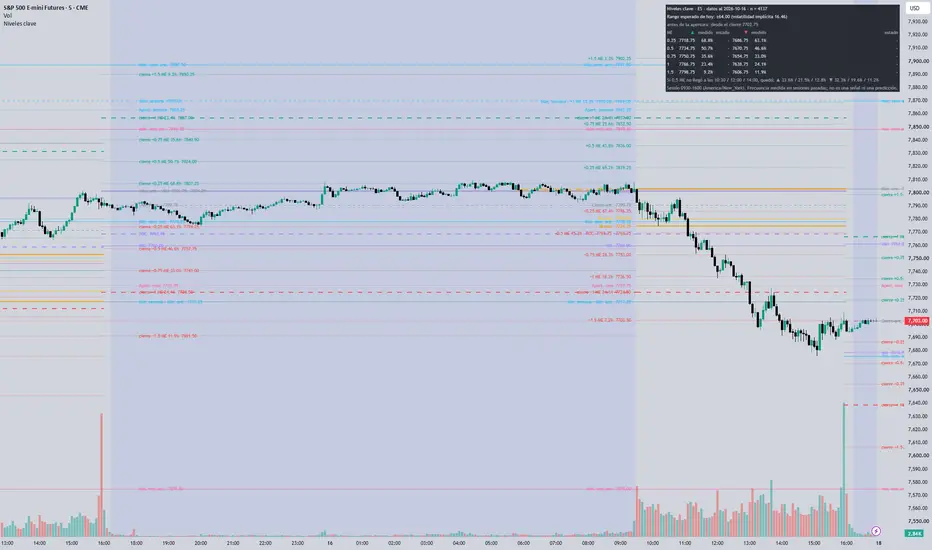
Key reference levels for futures day sessions, computed on the data of the chart you open it on, with the historical frequency at which each distance was reached printed next to it.
WHAT IT DRAWS
- Prior regular session: high, low, close, midpoint, value area high and low, and point of control. The profile is built from 30-minute time-at-price periods with a 70% value area.
- Prior week and prior month high and low, week and month open, and the week-to-date high and low (regular sessions only).
- Opening range (first 15 minutes) and initial balance (first 60 minutes) of the market's own day session, drawn once each window is complete.
- The expected move of the day and a ladder at 0.25, 0.5, 0.75, 1.0 and 1.5 expected moves from the open. Before the open, the same ladder is drawn from the prior close.
- A table with the expected move, the rungs already reached, and, by time of day, how often the rungs not yet reached were still reached later in the session.
HOW TO READ THE PERCENTAGES
Every percentage is a frequency measured on past sessions of that market: the share of sessions in which price travelled that distance from the open. Each one comes with its sample size in the table header. They describe how far price has travelled in the past, not where it will go, and nothing about any single day. This is not a signal and it does not suggest trades.
SESSIONS AND MARKETS
Session windows follow each market's day session in New York time (for example 09:30-16:00 for equity index futures, 08:20-13:30 for gold). The statistics are embedded for 29 futures markets and say up to which date they were measured. On symbols without embedded statistics, the levels are still drawn and the percentages are left blank instead of guessed.
NO REPAINTING
Prior-session, week and month levels are fixed when their period ends. The opening range and initial balance are fixed when their window is complete. Only the table updates inside the bar.
Works on charts from 1 to 60 minutes, on continuous or single-contract symbols.
WHAT IT DRAWS
- Prior regular session: high, low, close, midpoint, value area high and low, and point of control. The profile is built from 30-minute time-at-price periods with a 70% value area.
- Prior week and prior month high and low, week and month open, and the week-to-date high and low (regular sessions only).
- Opening range (first 15 minutes) and initial balance (first 60 minutes) of the market's own day session, drawn once each window is complete.
- The expected move of the day and a ladder at 0.25, 0.5, 0.75, 1.0 and 1.5 expected moves from the open. Before the open, the same ladder is drawn from the prior close.
- A table with the expected move, the rungs already reached, and, by time of day, how often the rungs not yet reached were still reached later in the session.
HOW TO READ THE PERCENTAGES
Every percentage is a frequency measured on past sessions of that market: the share of sessions in which price travelled that distance from the open. Each one comes with its sample size in the table header. They describe how far price has travelled in the past, not where it will go, and nothing about any single day. This is not a signal and it does not suggest trades.
SESSIONS AND MARKETS
Session windows follow each market's day session in New York time (for example 09:30-16:00 for equity index futures, 08:20-13:30 for gold). The statistics are embedded for 29 futures markets and say up to which date they were measured. On symbols without embedded statistics, the levels are still drawn and the percentages are left blank instead of guessed.
NO REPAINTING
Prior-session, week and month levels are fixed when their period ends. The opening range and initial balance are fixed when their window is complete. Only the table updates inside the bar.
Works on charts from 1 to 60 minutes, on continuous or single-contract symbols.
リリースノート
The levels drawn after the close for the next session now stay on the chart after the open, ending at the open, so there is no gap between the regular close and the next open. Internal parameter renamed (no change to any number).リリースノート
Labels of a finished session move to the start of that session, so they no longer overlap the labels of the next session's plan after the close. Alert names use a plain minus sign. No change to any level or percentage.
Perfiltrade — futures analysis with the sample in plain sight: historical base rates, Market Profile and COT across 30 instruments. No signals, no black boxes. perfiltrade.com
免責事項
これらの情報および投稿は、TradingViewが提供または承認する金融、投資、取引、またはその他の種類の助言もしくは推奨であることを意図したものではなく、またこれらに該当するものでもありません。詳細は利用規約をご覧ください。
Perfiltrade — futures analysis with the sample in plain sight: historical base rates, Market Profile and COT across 30 instruments. No signals, no black boxes. perfiltrade.com
免責事項
これらの情報および投稿は、TradingViewが提供または承認する金融、投資、取引、またはその他の種類の助言もしくは推奨であることを意図したものではなく、またこれらに該当するものでもありません。詳細は利用規約をご覧ください。