OPEN-SOURCE SCRIPT
MTF Bias Table
Script name
QE — MTF Bias Table
Short description
Multi‑timeframe trend bias dashboard. Compares fast vs. slow MA alignment across 5m through 1M to classify each timeframe as bullish or bearish at a glance.
Description
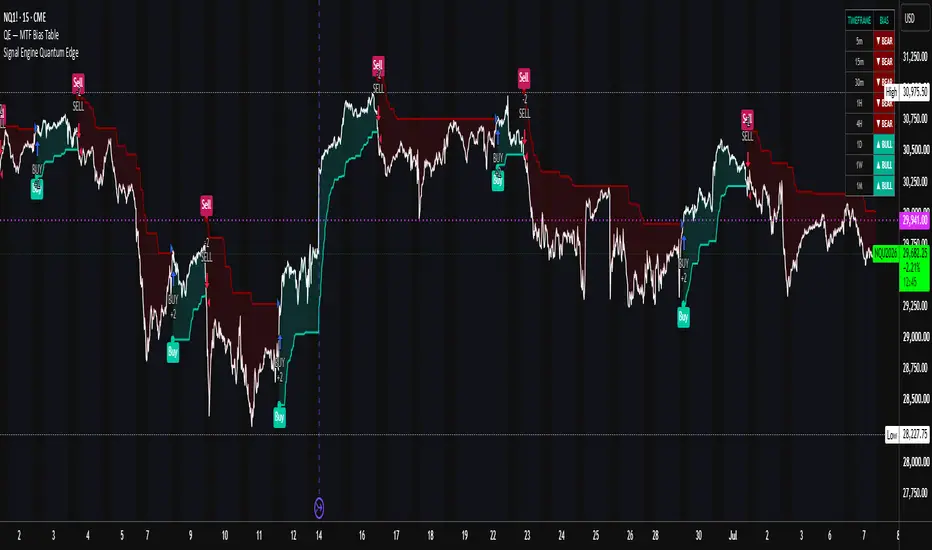
QE — MTF Bias Table is a non‑repainting, multi‑timeframe trend dashboard built for traders who need higher timeframe context before entering lower timeframe setups. It evaluates fast vs. slow moving average alignment across eight timeframes (5m, 15m, 30m, 1H, 4H, 1D, 1W, 1M) and prints a clean, color‑coded table directly on the chart.
The indicator is intentionally designed to pair with order‑flow, structure, and liquidity tools. It does not predict direction; it answers one question: “Is this timeframe aligned bullish or bearish?”
How it works
Fast MA > Slow MA = Bullish alignment (green “▲ BULL”)
Fast MA < Slow MA = Bearish alignment (red “▼ BEAR”)
All MTF requests use lookahead disabled to prevent repainting. The script reads a fresh close‑based value at each higher timeframe candle, so the bias state is stable and reflects the confirmed bar, not the developing one.
Configurable inputs
Fast MA Length (default 20)
Slow MA Length (default 50)
MA Type (EMA or SMA)
Why use this
Instantly see if your entry timeframe aligns with the daily/weekly bias
Avoid counter‑trend entries when the HTF is stacked against you
Use it as a filter: only trade setups that agree with the higher timeframe bias
Compact table design with minimal chart clutter
Tags
multi-timeframe
trend
bias
dashboard
Usage note
This is a bias filter, not an entry system. Combine it with your own structure, liquidity, and confirmation models for a complete trading plan.
QE — MTF Bias Table
Short description
Multi‑timeframe trend bias dashboard. Compares fast vs. slow MA alignment across 5m through 1M to classify each timeframe as bullish or bearish at a glance.
Description
QE — MTF Bias Table is a non‑repainting, multi‑timeframe trend dashboard built for traders who need higher timeframe context before entering lower timeframe setups. It evaluates fast vs. slow moving average alignment across eight timeframes (5m, 15m, 30m, 1H, 4H, 1D, 1W, 1M) and prints a clean, color‑coded table directly on the chart.
The indicator is intentionally designed to pair with order‑flow, structure, and liquidity tools. It does not predict direction; it answers one question: “Is this timeframe aligned bullish or bearish?”
How it works
Fast MA > Slow MA = Bullish alignment (green “▲ BULL”)
Fast MA < Slow MA = Bearish alignment (red “▼ BEAR”)
All MTF requests use lookahead disabled to prevent repainting. The script reads a fresh close‑based value at each higher timeframe candle, so the bias state is stable and reflects the confirmed bar, not the developing one.
Configurable inputs
Fast MA Length (default 20)
Slow MA Length (default 50)
MA Type (EMA or SMA)
Why use this
Instantly see if your entry timeframe aligns with the daily/weekly bias
Avoid counter‑trend entries when the HTF is stacked against you
Use it as a filter: only trade setups that agree with the higher timeframe bias
Compact table design with minimal chart clutter
Tags
multi-timeframe
trend
bias
dashboard
Usage note
This is a bias filter, not an entry system. Combine it with your own structure, liquidity, and confirmation models for a complete trading plan.
オープンソーススクリプト
TradingViewの精神に則り、このスクリプトの作者はコードをオープンソースとして公開してくれました。トレーダーが内容を確認・検証できるようにという配慮です。作者に拍手を送りましょう!無料で利用できますが、コードの再公開はハウスルールに従う必要があります。

Any Questions or concerns, contact: Founder@quantumedge.finance
Sincerly, Alexander Morhan
Sincerly, Alexander Morhan
免責事項
これらの情報および投稿は、TradingViewが提供または承認する金融、投資、取引、またはその他の種類の助言もしくは推奨であることを意図したものではなく、またこれらに該当するものでもありません。詳細は利用規約をご覧ください。
オープンソーススクリプト
TradingViewの精神に則り、このスクリプトの作者はコードをオープンソースとして公開してくれました。トレーダーが内容を確認・検証できるようにという配慮です。作者に拍手を送りましょう!無料で利用できますが、コードの再公開はハウスルールに従う必要があります。
Any Questions or concerns, contact: Founder@quantumedge.finance
Sincerly, Alexander Morhan
Sincerly, Alexander Morhan
免責事項
これらの情報および投稿は、TradingViewが提供または承認する金融、投資、取引、またはその他の種類の助言もしくは推奨であることを意図したものではなく、またこれらに該当するものでもありません。詳細は利用規約をご覧ください。