OPEN-SOURCE SCRIPT
OB + 2G2R + EMA/BB/ST/VWAP + Doji + Day Levels
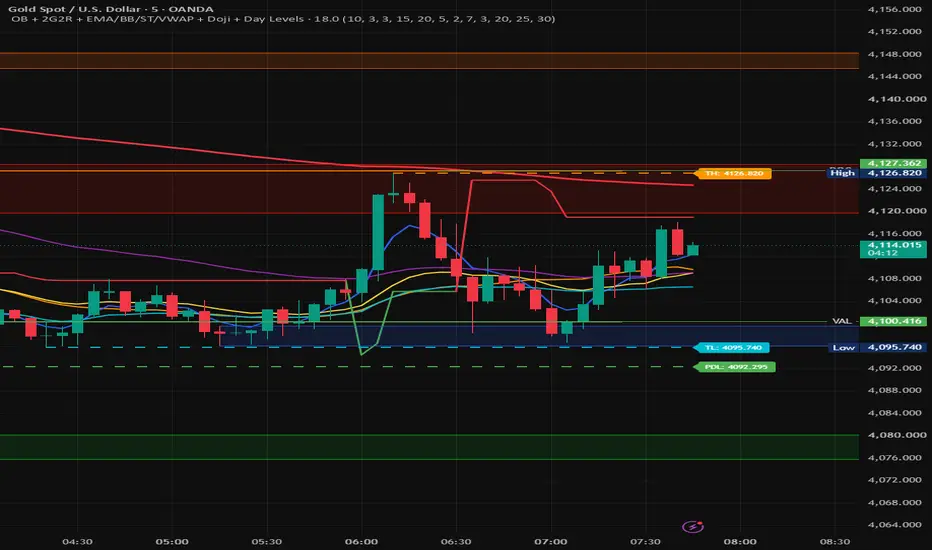
It is a multi-signal chart indicator. It does not place trades automatically; it plots trend tools, levels, and buy/sell markers.
It shows:
BB Mid — the 20-period SMA, used as the crossover reference.
EMA 5, EMA 20, EMA 50, EMA 200 — trend direction filters.
SuperTrend — green when bullish and red when bearish.
Today’s High and Today’s Low — running intraday high/low levels, updated as new candles form.
EMA BUY — EMA 5 crosses above BB Mid, the candle is bullish, and price is above EMA 20/50/200.
EMA SELL — EMA 5 crosses below BB Mid, the candle is bearish, and price is below EMA 20/50/200.
ST BUY / ST SELL — SuperTrend direction changes and the current candle breaks the previous candle’s high or low.
2R2G BUY — two bearish candles followed by two bullish candles.
2G2R SELL — two bullish candles followed by two bearish candles.
Doji Buy / Sell setups — a bullish-to-bearish or bearish-to-bullish two-candle sequence followed by a small-body doji.
The signals are independent. For example, a 2R2G marker does not require an EMA crossover or SuperTrend confirmation. The strongest practical use is to treat EMA trend, SuperTrend direction, and the candle pattern as confirmation together rather than entering on every marker.
It shows:
BB Mid — the 20-period SMA, used as the crossover reference.
EMA 5, EMA 20, EMA 50, EMA 200 — trend direction filters.
SuperTrend — green when bullish and red when bearish.
Today’s High and Today’s Low — running intraday high/low levels, updated as new candles form.
EMA BUY — EMA 5 crosses above BB Mid, the candle is bullish, and price is above EMA 20/50/200.
EMA SELL — EMA 5 crosses below BB Mid, the candle is bearish, and price is below EMA 20/50/200.
ST BUY / ST SELL — SuperTrend direction changes and the current candle breaks the previous candle’s high or low.
2R2G BUY — two bearish candles followed by two bullish candles.
2G2R SELL — two bullish candles followed by two bearish candles.
Doji Buy / Sell setups — a bullish-to-bearish or bearish-to-bullish two-candle sequence followed by a small-body doji.
The signals are independent. For example, a 2R2G marker does not require an EMA crossover or SuperTrend confirmation. The strongest practical use is to treat EMA trend, SuperTrend direction, and the candle pattern as confirmation together rather than entering on every marker.
オープンソーススクリプト
TradingViewの精神に則り、このスクリプトの作者はコードをオープンソースとして公開してくれました。トレーダーが内容を確認・検証できるようにという配慮です。作者に拍手を送りましょう!無料で利用できますが、コードの再公開はハウスルールに従う必要があります。

免責事項
これらの情報および投稿は、TradingViewが提供または承認する金融、投資、取引、またはその他の種類の助言もしくは推奨であることを意図したものではなく、またこれらに該当するものでもありません。詳細は利用規約をご覧ください。
オープンソーススクリプト
TradingViewの精神に則り、このスクリプトの作者はコードをオープンソースとして公開してくれました。トレーダーが内容を確認・検証できるようにという配慮です。作者に拍手を送りましょう!無料で利用できますが、コードの再公開はハウスルールに従う必要があります。
免責事項
これらの情報および投稿は、TradingViewが提供または承認する金融、投資、取引、またはその他の種類の助言もしくは推奨であることを意図したものではなく、またこれらに該当するものでもありません。詳細は利用規約をご覧ください。