OPEN-SOURCE SCRIPT
Fear & Greed Index
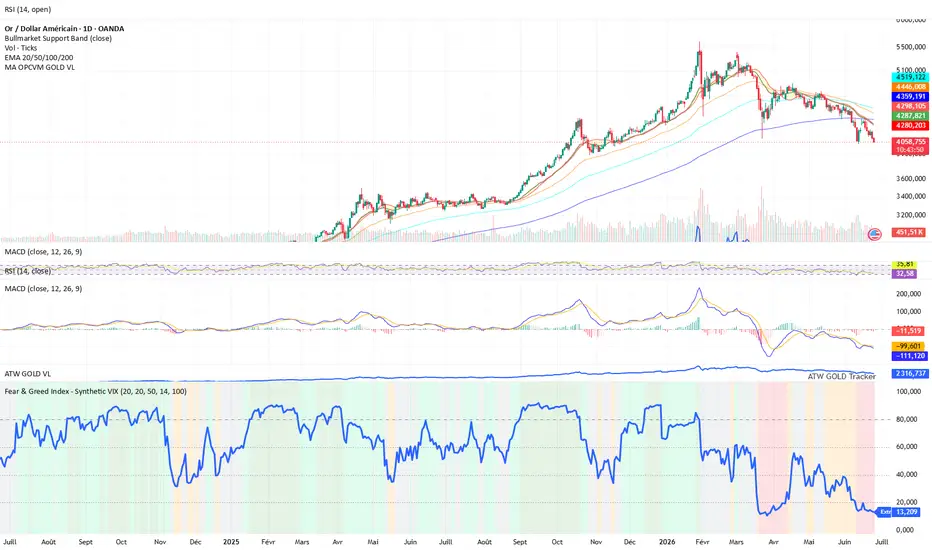
The Fear & Greed Index is a synthetic market sentiment indicator designed to convert multiple technical signals into a single 0–100 score.
Its purpose is to quickly identify market phases of fear, neutrality, or greed across any asset or index.
This indicator does not rely on an official VIX.
Instead, it uses synthetic realized volatility, combined with trend and momentum metrics, to provide a visual reading of market sentiment and regime conditions.
Methodology
The score is built from several components:
Realized volatility
used as a market stress proxy: higher volatility pushes the index toward fear.
Momentum
captures recent price acceleration or deterioration.
RSI
evaluates market strength and overbought / oversold conditions.
Trend vs moving average
compares current price to its moving average to assess directional bias.
Drawdown
measures the distance from recent highs to identify stress, correction, or recovery phases.
Score interpretation
The final score is normalized between 0 and 100:
0 – 20 → Extreme Fear
20 – 40 → Fear
40 – 60 → Neutral
60 – 80 → Greed
80 – 100 → Extreme Greed
How to use it
Low readings usually reflect stressed, volatile, or corrective market conditions.
High readings usually reflect confident, bullish, or potentially overheated market conditions.
The indicator is best used as a market regime / sentiment filter, not as a standalone buy or sell signal.
Disclaimer
This script is a synthetic sentiment indicator based on price and volume data.
It is not an official volatility index and should not be considered investment advice.
Its purpose is to quickly identify market phases of fear, neutrality, or greed across any asset or index.
This indicator does not rely on an official VIX.
Instead, it uses synthetic realized volatility, combined with trend and momentum metrics, to provide a visual reading of market sentiment and regime conditions.
Methodology
The score is built from several components:
Realized volatility
used as a market stress proxy: higher volatility pushes the index toward fear.
Momentum
captures recent price acceleration or deterioration.
RSI
evaluates market strength and overbought / oversold conditions.
Trend vs moving average
compares current price to its moving average to assess directional bias.
Drawdown
measures the distance from recent highs to identify stress, correction, or recovery phases.
Score interpretation
The final score is normalized between 0 and 100:
0 – 20 → Extreme Fear
20 – 40 → Fear
40 – 60 → Neutral
60 – 80 → Greed
80 – 100 → Extreme Greed
How to use it
Low readings usually reflect stressed, volatile, or corrective market conditions.
High readings usually reflect confident, bullish, or potentially overheated market conditions.
The indicator is best used as a market regime / sentiment filter, not as a standalone buy or sell signal.
Disclaimer
This script is a synthetic sentiment indicator based on price and volume data.
It is not an official volatility index and should not be considered investment advice.
オープンソーススクリプト
TradingViewの精神に則り、このスクリプトの作者はコードをオープンソースとして公開してくれました。トレーダーが内容を確認・検証できるようにという配慮です。作者に拍手を送りましょう!無料で利用できますが、コードの再公開はハウスルールに従う必要があります。

免責事項
これらの情報および投稿は、TradingViewが提供または承認する金融、投資、取引、またはその他の種類の助言もしくは推奨であることを意図したものではなく、またこれらに該当するものでもありません。詳細は利用規約をご覧ください。
オープンソーススクリプト
TradingViewの精神に則り、このスクリプトの作者はコードをオープンソースとして公開してくれました。トレーダーが内容を確認・検証できるようにという配慮です。作者に拍手を送りましょう!無料で利用できますが、コードの再公開はハウスルールに従う必要があります。
免責事項
これらの情報および投稿は、TradingViewが提供または承認する金融、投資、取引、またはその他の種類の助言もしくは推奨であることを意図したものではなく、またこれらに該当するものでもありません。詳細は利用規約をご覧ください。