OPEN-SOURCE SCRIPT
CVD Oscillator (BEST)
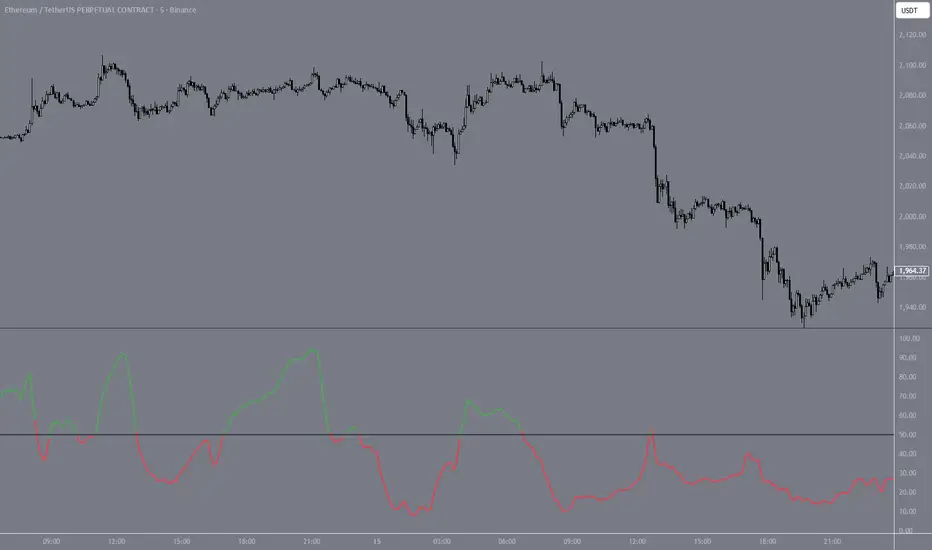
Estimates Cumulative Volume Delta from OHLCV candle data and normalizes it to a 0-100 scale. Approximates order flow without tick-level data by measuring where each candle closes within its range, weighted by volume — closes near the high register as buying pressure, closes near the low as selling pressure.
The raw CVD is normalized over a rolling lookback window and smoothed with an EMA. Readings above 50 indicate buyers dominating relative to recent history, below 50 indicates sellers. Useful for spotting divergences between price and volume flow — e.g. price making new highs while the oscillator declines suggests weakening buyer conviction.
The raw CVD is normalized over a rolling lookback window and smoothed with an EMA. Readings above 50 indicate buyers dominating relative to recent history, below 50 indicates sellers. Useful for spotting divergences between price and volume flow — e.g. price making new highs while the oscillator declines suggests weakening buyer conviction.
オープンソーススクリプト
TradingViewの精神に則り、このスクリプトの作者はコードをオープンソースとして公開してくれました。トレーダーが内容を確認・検証できるようにという配慮です。作者に拍手を送りましょう!無料で利用できますが、コードの再公開はハウスルールに従う必要があります。

免責事項
これらの情報および投稿は、TradingViewが提供または承認する金融、投資、取引、またはその他の種類の助言もしくは推奨であることを意図したものではなく、またこれらに該当するものでもありません。詳細は利用規約をご覧ください。
オープンソーススクリプト
TradingViewの精神に則り、このスクリプトの作者はコードをオープンソースとして公開してくれました。トレーダーが内容を確認・検証できるようにという配慮です。作者に拍手を送りましょう!無料で利用できますが、コードの再公開はハウスルールに従う必要があります。
免責事項
これらの情報および投稿は、TradingViewが提供または承認する金融、投資、取引、またはその他の種類の助言もしくは推奨であることを意図したものではなく、またこれらに該当するものでもありません。詳細は利用規約をご覧ください。