As originally described by Adam H. Grimes.
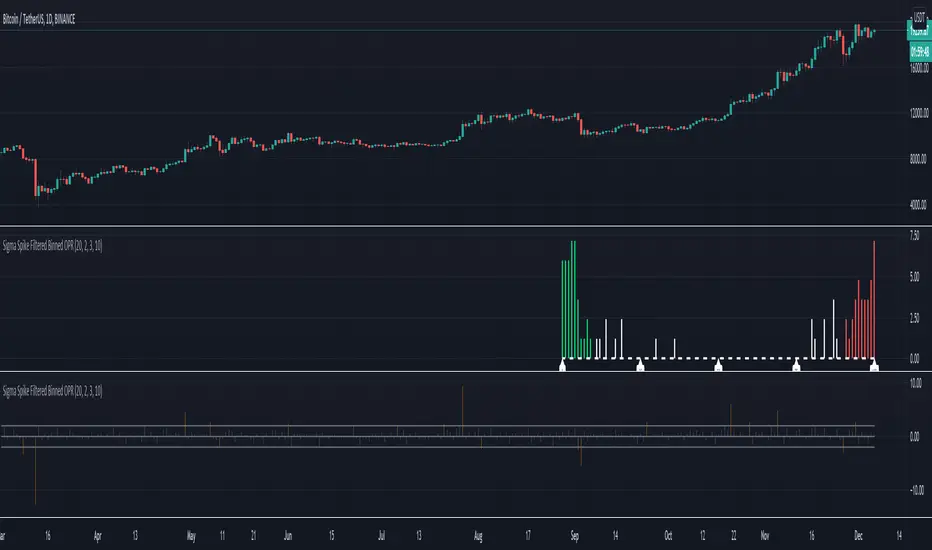
For analyzing the location of Open within the day's range (OPR). The OPR histogram displays the binned distribution of OPR values for the chart history. Fat tails at the extremes indicates that Open occurred more often close to the day's high or low.
The OPR results are filtered according to volatility using Grime's Sigma Spike. So that OPR values are only recorded when volatility exceeds a threshold (relative high range days).
This may (strong emphasis on may) indicate the opportunity for trades early in the day on days that begin with a high amount of relative volatility and trading with the direction that price is moving away from the open.
For analyzing the location of Open within the day's range (OPR). The OPR histogram displays the binned distribution of OPR values for the chart history. Fat tails at the extremes indicates that Open occurred more often close to the day's high or low.
The OPR results are filtered according to volatility using Grime's Sigma Spike. So that OPR values are only recorded when volatility exceeds a threshold (relative high range days).
This may (strong emphasis on may) indicate the opportunity for trades early in the day on days that begin with a high amount of relative volatility and trading with the direction that price is moving away from the open.
リリースノート
There is now also a follow on script here which allows further breakdown by hour of the day and day of the weekオープンソーススクリプト
TradingViewの精神に則り、このスクリプトの作者はコードをオープンソースとして公開してくれました。トレーダーが内容を確認・検証できるようにという配慮です。作者に拍手を送りましょう!無料で利用できますが、コードの再公開はハウスルールに従う必要があります。

免責事項
これらの情報および投稿は、TradingViewが提供または承認する金融、投資、取引、またはその他の種類の助言もしくは推奨であることを意図したものではなく、またこれらに該当するものでもありません。詳細は利用規約をご覧ください。
オープンソーススクリプト
TradingViewの精神に則り、このスクリプトの作者はコードをオープンソースとして公開してくれました。トレーダーが内容を確認・検証できるようにという配慮です。作者に拍手を送りましょう!無料で利用できますが、コードの再公開はハウスルールに従う必要があります。
免責事項
これらの情報および投稿は、TradingViewが提供または承認する金融、投資、取引、またはその他の種類の助言もしくは推奨であることを意図したものではなく、またこれらに該当するものでもありません。詳細は利用規約をご覧ください。