[Abaco] MTF MAs Labelled Ribbon - Moving Averages
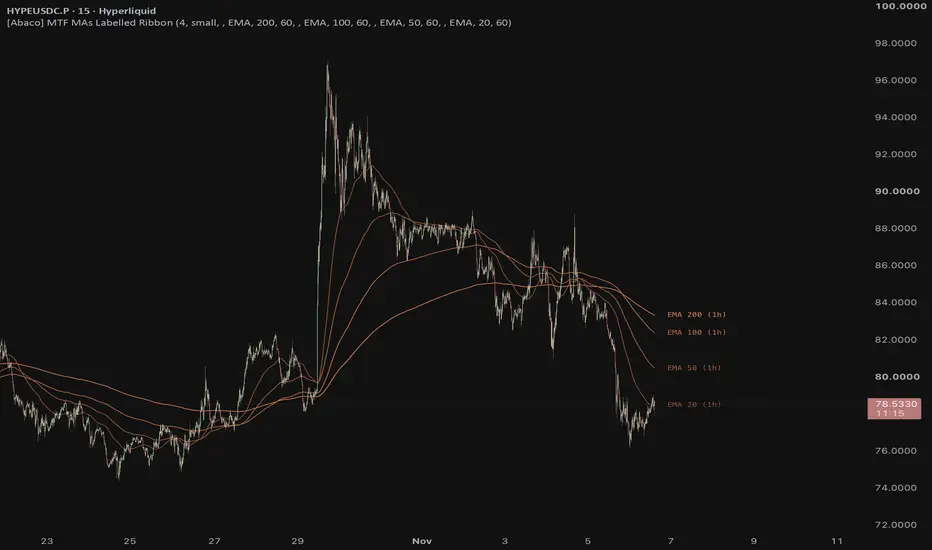
Four moving averages, each calculated on a timeframe of its own and drawn on any chart, whatever timeframe you are looking at. That is what multi-timeframe (MTF) means here. Switch the chart from 5 minutes to 4 hours and the averages stay where they are.
Each average has its own type (SMA, EMA, RMA, WMA or VWMA), length and timeframe. The defaults are the EMAs 20, 50, 100 and 200, all calculated on 1-hour bars, in shades of one colour, the brightest for the slowest. Each line has a label at the right edge of the chart with its type, length and calculation timeframe, for example EMA 200 (1h), so the ribbon reads at a glance.
How to read it. Each average is calculated on its own timeframe from the average of high, low and close. When that timeframe is above the chart's, the value changes once per bar of that timeframe and would draw steps, so by default it is smoothed into a straight line between its last two closed values. It never repaints and trails the exact value by up to one bar of that timeframe. The smoothing can be switched off. Labels can be renamed, resized or switched off.
What it does not do. It gives no signals and says nothing about where to enter.
Open source. Educational. Not investment advice.
Each average has its own type (SMA, EMA, RMA, WMA or VWMA), length and timeframe. The defaults are the EMAs 20, 50, 100 and 200, all calculated on 1-hour bars, in shades of one colour, the brightest for the slowest. Each line has a label at the right edge of the chart with its type, length and calculation timeframe, for example EMA 200 (1h), so the ribbon reads at a glance.
How to read it. Each average is calculated on its own timeframe from the average of high, low and close. When that timeframe is above the chart's, the value changes once per bar of that timeframe and would draw steps, so by default it is smoothed into a straight line between its last two closed values. It never repaints and trails the exact value by up to one bar of that timeframe. The smoothing can be switched off. Labels can be renamed, resized or switched off.
What it does not do. It gives no signals and says nothing about where to enter.
Open source. Educational. Not investment advice.

Abaco
Count twice, trade once
abaco.phisys.app
Count twice, trade once
abaco.phisys.app
免責事項
これらの情報および投稿は、TradingViewが提供または承認する金融、投資、取引、またはその他の種類の助言もしくは推奨であることを意図したものではなく、またこれらに該当するものでもありません。詳細は利用規約をご覧ください。
Abaco
Count twice, trade once
abaco.phisys.app
Count twice, trade once
abaco.phisys.app
免責事項
これらの情報および投稿は、TradingViewが提供または承認する金融、投資、取引、またはその他の種類の助言もしくは推奨であることを意図したものではなく、またこれらに該当するものでもありません。詳細は利用規約をご覧ください。