Markov Regime Oscillator PRO
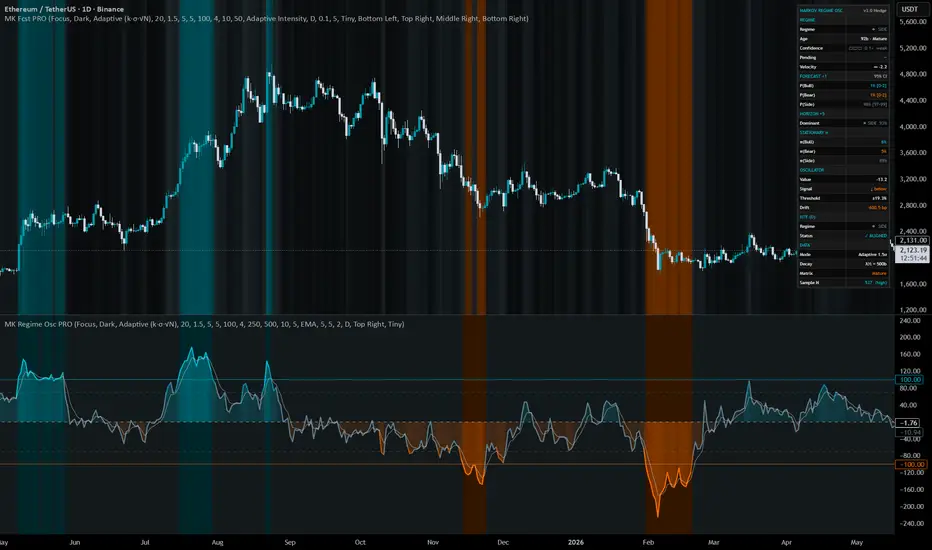
🟦 Markov Regime Oscillator PRO is a quantitative regime-classification and forward-probability forecasting engine rendered as a centred oscillator panel. Every bar is classified into one of three regimes — Bull, Bear, Sideways — using a drift-adjusted, volatility-normalised k·σ·√N threshold. The regime sequence feeds two parallel semi-Markov transition matrices (Young / Mature) with exponentially-decayed counts, producing live N-bar forward probabilities and 95 % Bayesian credible intervals on the next-bar probability vector.
The indicator integrates nine analytical layers — drift-adjusted classification, adaptive k·σ·√N threshold, EWMA-decayed transition matrix, semi-Markov duration conditioning, N-bar forecast cone via matrix iteration, Bayesian credible intervals, stationary distribution, velocity precursor with optional momentum filter, and multi-timeframe confluence — each rendered on a single oscillator panel through reference levels, a regime ribbon, gradient fill, three-layer neon glow signals, and an in-panel forecast polyline. A 30-row PRO status dashboard rendered on the main price chart (not the oscillator panel) reports every readout in real time.
Built with mathematical honesty. Every +1 forward probability carries a 95 % Dirichlet-posterior credible interval, the EWMA half-life is user-set so the model can adapt as market character evolves (2020 ≠ 2024), the semi-Markov split splits the chain on regime age so mature trends are not treated like young ones, and the documentation is explicit about what the model can and cannot predict.
🟦 HOW THE CORE ENGINE WORKS
Regime Classification
Each bar, the engine measures the rolling N-bar log return — optionally adjusted for the long-term drift of the asset:
logRet_raw = log(close / close[N])
meanDrift = SMA(log(close / close[1]), driftWin)
logRet = logRet_raw − N × meanDrift (when Drift Adjustment is ON)
The bar is labelled by comparing this return against the configured boundary:
- `logRet > +threshold` → BULL
- `logRet < −threshold` → BEAR
- otherwise → SIDEWAYS
The classification runs every bar with no look-ahead. When the optional Momentum Filter is enabled, the Bull / Bear labels additionally require the oscillator velocity to agree with the direction — killing late entries on exhausted moves.
Adaptive Threshold (k · σ · √N)
Traditional Markov regime indicators use a fixed percentage cut — e.g. "±5 % over 20 bars". This collapses on real markets: the same 5 % is trivial in a 2017 mania and never reached in 2023 chop. The fix is to scale the boundary with realised volatility:
threshold_adaptive = k × σ × √N
where σ is the per-bar log-return standard deviation over a configurable window (default 100 bars). Under a random walk, k = 1.0 cuts at the 16th / 84th percentiles; k = 2.0 at the 2.5th / 97.5th percentiles. The default k = 1.5 reproduces classic ±1.5-sigma thresholds.
Fixed-percentage mode is still available for users who want to lock the threshold deliberately.
Drift Adjustment (Alpha-Adjusted Classification)
Strong-trending markets (long BTC bull runs, persistently uptrending equity indices) carry a non-zero baseline drift. Without adjustment, the rolling log return systematically exceeds zero in such markets — producing excessive Bull-regime flips that reflect baseline drift rather than incremental kinetic energy.
The fix is to subtract the long-term mean drift before threshold comparison:
logRet_excess = log(close / close[N]) − N × mean(log returns, driftWin)
Log returns become EXCESS returns over the asset's own long-run drift — what quant desks call "alpha-adjusted" classification. The default 250-bar drift window approximates one trading year on the daily timeframe.
Oscillator Value
The classified log return is normalised by the active threshold and scaled to ±100 = boundary, clipped at ±300:
oscVal = clip( logRet / threshold × 100, ±300 )
The oscillator value is the central panel signal. Reference levels at ±100 (solid) mark the official regime boundaries, ±70 (dashed) mark the pending early-warning zone, and 0 (dashed) is the neutral midline.
Regime Confidence
Once classified, the move's strength is normalised relative to the active boundary:
confidence = |logRet| / threshold
| Confidence | Tier | Visual |
|---|---|---|
| < 1.0× | weak | ▱▱▱ |
| 1.0× – 2.0× | moderate | ▰▱▱ |
| 2.0× – 3.0× | strong | ▰▰▱ |
| ≥ 3.0× | stretched | ▰▰▰ |
The confidence value feeds the High Confidence alert (≥ 2.5× trigger) and is reported in the Status dashboard.
🟦 EWMA DECAY ON TRANSITION COUNTS
The Ancient-History Problem
A classic Markov chain counts every historical transition with equal weight — a Bull→Bear flip from five years ago contributes the same as one from yesterday. This breaks when market character changes: the 2020 COVID crash regime dynamics are not the same as 2024 retail mania, but a vanilla counter weighs them identically.
The Refinement (EWMA / RiskMetrics-style decay)
Markov Regime Oscillator PRO applies exponential decay to the transition counts every confirmed bar BEFORE incrementing for the new transition:
decayFactor = 0.5 ^ (1 / halfLife)
counts[k] = counts[k] × decayFactor (all 9 cells, every bar)
counts[idx] = counts[idx] + 1.0 (new transition)
After `halfLife` bars, an old count weighs HALF its original. This is the same math RiskMetrics uses for EWMA volatility — adapted here to regime transition memory.
| Half-life | Behaviour |
|---|---|
| 50 – 200 | highly reactive — adapts fast, probabilities noisy |
| 300 – 700 | balanced (default 500) |
| 1000+ | stable — slow adaptation, smooth probabilities |
The decay is applied to all three matrices in lockstep (full, young, mature) so the semi-Markov split below stays internally consistent.
🟦 SEMI-MARKOV DURATION CONDITIONING
The Memoryless Problem
A standard Markov chain says: "Given I'm in Bull, the probability of staying Bull tomorrow is X — regardless of whether Bull started yesterday or 200 bars ago." This is the memoryless property, and on real markets it's wrong. A 200-bar-old Bull regime carries different mean-reversion risk than a 5-bar-old one.
The Refinement
Markov Regime Oscillator PRO additionally builds two CONDITIONAL transition matrices:
- `P_young` — transitions counted when the source regime's age was below the Age Median input
- `P_mature` — transitions counted when the source regime's age was at or above the Age Median
Both matrices are constructed in parallel with the unconditional matrix, using the same per-bar bucketing logic, the same EWMA decay, and the same Dirichlet smoothing.
The active forecast then uses the matrix matching the CURRENT regime's tier — Young or Mature. A 5-bar-old Bull is statistically more likely to continue than a 50-bar-old one; semi-Markov captures this empirically without leaking into the unconditional chain.
The active matrix tier is reported live in the Status dashboard's "Matrix" cell.
🟦 N-BAR FORECAST CONE
Matrix Iteration
The 3×3 transition matrix P encodes one-bar-ahead probabilities. To project further out, the state vector is iterated through P:
s_0 = [P(Side), P(Bull), P(Bear)] = unit vector on current regime
s_{k+1} = s_k · P (matrix multiplication)
For each step k = 1 … forecastSteps, the iteration produces the probability of each regime at that future bar.
Expected Oscillator Value
At each forecast step, the expected oscillator value is computed as:
E[osc | k] = 100 · ( P(Bull | k) − P(Bear | k) )
This number is +100 when the model expects pure Bull, −100 when pure Bear, and ~0 when Side.
In-Panel Polyline
The cone is rendered as a colored polyline extending PAST the last confirmed bar into the future, drawn via `line.new()` so segments are pixel-stable on any chart zoom. Each segment is colored by the dominant regime at that step (Bull / Bear / Side).
Honest Limitation
The cone is reliable up to ~5 bars; beyond that the iteration converges toward the stationary distribution and the forecast loses information. The default Forecast Horizon is 5 bars — covers the meaningful window without illusion.
The forecast is matrix-implied, not a momentum extrapolation. If the oscillator is currently at +250 (strong Bull) but the matrix says P(Bull → Side) is high, the cone will regress to the matrix-implied expected value — showing a visual "cliff" at step 1. This is mathematically honest, not a bug.
The dashboard's "HORIZON +N" cell reports the dominant regime at the terminal forecast step plus its probability — for a single-glance read of where the chain expects to be at horizon end.
🟦 BAYESIAN CREDIBLE INTERVALS
Why Ranges, Not Point Estimates
A forecast like "P(Bull) +1 = 75 %" carries hidden uncertainty. With only 30 historical Bull-source transitions, the true probability could plausibly be anywhere between 55 % and 90 %. With 2000 historical Bull-source transitions, the same 75 % is tightly bracketed at, say, 73 – 77 %.
Reporting a single number hides the difference. Hedge-fund and academic forecasts always carry uncertainty bands; this oscillator does the same.
The Derivation (Dirichlet Posterior, Gaussian Approximation)
The transition matrix posterior is Dirichlet(α + counts) with Laplace (α = 1) prior. Each marginal is Beta with parameters (α_i, Σα − α_i). The Gaussian approximation to that Beta gives:
mean = α_i / Σα
var = α_i · (Σα − α_i) / ( Σα² · (Σα + 1) )
95 % CI ≈ mean ± 1.96 · √var
The CI is computed for the +1 row (the most actionable forecast) and clipped to [0, 1].
Reading the Dashboard
P(Bull) +1 75 % [68 – 82]
| CI Width | Interpretation |
|---|---|
| Narrow (e.g. 73 – 77) | large sample, robust estimate, trust the call |
| Wide (e.g. 50 – 95) | small sample, fragile estimate, don't bet the desk |
This is the difference between a quantitative estimate and an indicator guess.
🟦 STATIONARY DISTRIBUTION π
Power-iterating the matrix to convergence yields the stationary distribution — the long-run probability of being in each regime, independent of the current state. With 50 iterations on a well-behaved stochastic matrix, the distribution is essentially converged.
π(Side) + π(Bull) + π(Bear) = 1.0
The dashboard's "STATIONARY π" section reports each component. Reading π reveals the asset's structural bias regardless of the current regime — e.g., π(Bull) = 55 % on BTC daily tells you the market spends a majority of its time in Bull regimes over the long run, which is fundamentally different from a sideways-grinding instrument with π(Side) = 60 %.
The stationary distribution also serves as the asymptote of the forecast cone: as k → ∞, the cone collapses to π.
🟦 VELOCITY PRECURSOR & MOMENTUM FILTER
Velocity Definition
The oscillator velocity is the N-bar rate-of-change of the oscillator value:
velocity = oscVal − oscVal[velocityWin]
velocityThr = VELOCITY_BASE · √(velocityWin / 5)
The threshold auto-scales with the window so the accel / decel / flat labels stay meaningful at any setting.
Early-Warning Cue
Velocity flips direction BEFORE the official ±100 boundary is crossed — it is a leading indicator of regime change. The Status dashboard's "Velocity" cell displays:
- ↑ accelerating (velocity > +threshold) — colored bull
- ↓ decelerating (velocity < −threshold) — colored bear
- ═ flat — neutral
This partially mitigates the inherent lookback lag of threshold-based regime detection.
Optional Momentum Filter
When the Momentum Filter is enabled, regime classification additionally requires velocity sign agreement:
Bull → logRet > +threshold AND velocity > 0
Bear → logRet < −threshold AND velocity < 0
This kills late-entry signals where price has extended past the threshold but momentum is already exhausted — a classic source of false signals at trend tops/bottoms. Reduces signal count, raises signal quality. Recommended for swing trading, optional for scalping.
🟦 PENDING-REGIME EARLY WARNING
Because the regime is classified from `log(close / close[N])`, the official regime label inherently lags. This is structural, not a bug, but can be partially mitigated.
Inside Sideways, when the log return reaches 70 % of either boundary, the dashboard fires an early-warning cue:
distance_fraction = max(|logRet| / threshold, ...)
isPending = (regime == SIDE) AND (distance_fraction ≥ 0.70)
The Status panel's "Pending" cell displays the direction the return is leaning toward and the current fraction:
⚠ ▲ BULL 87 %
Color matches the leaning regime. The Pending Regime alert (default OFF, opt-in) fires on the first bar a pending state is entered.
This is not a regime change signal — it's a "watch this" cue, triggered roughly 30 % before the official threshold is crossed. Used alongside the official regime change, it gives the user advance notice without compromising the threshold's strictness.
🟦 SELECTABLE SIGNAL SMOOTHING
A second smoothed signal line overlays the main oscillator. Crossovers between the main and signal lines mark momentum-of-regime shifts — these often precede actual regime changes by 1-3 bars.
Four smoothing algorithms are available:
| Method | Character |
|---|---|
| EMA (default) | Exponential — classic lag/smoothness |
| HMA | Hull — near-zero lag for short windows |
| ALMA | Arnaud Legoux (0.85, 6.0) — Gaussian-weighted, smoothest |
| SMA | Simple — most stable, most lag |
The Signal Cross alert can be optionally filtered by HTF alignment — when enabled, the alert fires only when LTF and HTF regimes match. Filter is auto-bypassed when HTF Confluence is globally OFF (silent-kill protection).
🟦 MULTI-TIMEFRAME CONFLUENCE
The same regime logic runs on a user-configured higher timeframe via `request.security` with `lookahead = barmerge.lookahead_off` and `gaps = barmerge.gaps_off` (anti-repaint mandatory). The result is reported in the Status dashboard's HTF block:
| State | Display | Color |
|---|---|---|
| HTF regime matches LTF regime | ✓ ALIGNED | bull |
| HTF regime differs from LTF | ⚠ DIVERGENT | bear |
| Insufficient HTF data | — | foreground |
Divergent regimes are common at trend turns — the LTF flips before the HTF catches up. Aligned regimes carry higher conviction. A separate alert ("MTF Confluence") fires on regime entries only when the HTF agrees.
Recommended pairings:
| Chart | HTF |
|---|---|
| 15m | 1H |
| 1H | D |
| 4H | W |
| D | W |
| W | M |
Use at least 3× your chart timeframe — anything closer and the two regimes track each other with no information gain.
🟦 OSCILLATOR PANEL VISUAL LAYER
Main Oscillator Line
The oscillator value plotted as a continuous line with five color tiers reflecting regime strength:
| Range | Color |
|---|---|
| ≥ +100 | full Bull |
| +70 to +100 | dim Bull (pending up) |
| −70 to +70 | neutral Side |
| −100 to −70 | dim Bear (pending down) |
| ≤ −100 | full Bear |
Line width is configurable 1 – 5 pixels.
Signal Line
A smoothed overlay of the main oscillator, faded foreground color, single-pixel width. Drives the Signal Cross alert and the dashboard Signal cell.
Reference Levels
Three horizontal levels per panel side:
- ±100 — official regime boundaries (solid plot line)
- ±70 — pending early-warning zones (dashed `line.new`)
- 0 — neutral midline (dashed `line.new`)
The dashed lines use `line.new()` rather than `plot.style_circles` so they remain pixel-stable at any chart zoom — they will NOT rescale or fragment.
Regime Ribbon
The oscillator panel background is tinted to the current regime color at 20 % opacity. Provides instant regime context at a glance — Bull / Bear / Side periods are visually separated even when zoomed out on long history. Toggleable.
Gradient Fill
The area between the oscillator line and zero is filled in the regime color, with intensity scaling adaptively by distance from zero — stronger color = higher conviction. Empty at zero.
Three-Layer Neon Glow Signals
On every confirmed regime transition (after the Min Hold filter passes), the indicator drops a three-layer halo on the oscillator line:
| Layer | Size | Transparency | Purpose |
|---|---|---|---|
| Outer | size.large | 80 % | Soft halo |
| Middle | size.normal | 50 % | Mid-glow |
| Core | size.small | 0 % | Bright center |
Bull entries (▲ triangle up), Bear entries (▼ triangle down), and Side entries (◆ diamond). The Min Hold input (default 4 bars) requires a new regime to persist before its flip is drawn — kills label spam in choppy zones without affecting the underlying transition counts.
Forecast Cone Polyline
On the last confirmed bar, a colored polyline extends into the future for N bars, plotting the expected oscillator value at each step. Color reflects the dominant regime at that step. Drawn with `line.new()` so segments are pixel-stable; recomputed on every chart refresh.
🟦 PRO STATUS DASHBOARD
A single dashboard rendered on the MAIN PRICE CHART (not the oscillator panel) via `force_overlay = true`. This keeps the oscillator panel uncluttered so the oscillator line, signal line, gradient fill, and forecast cone get the full pane height.
The dashboard is structured in seven sections, all theme-aware:
| Section | Cells |
|---|---|
| REGIME | Regime, Age + tier, Confidence, Pending, Velocity |
| FORECAST +1 | P(Bull), P(Bear), P(Side) — each with 95 % CI |
| HORIZON +N | Dominant regime at terminal forecast step + probability |
| STATIONARY π | π(Bull), π(Bear), π(Side) — long-run equilibrium |
| OSCILLATOR | Value, Signal direction, Threshold, Drift basis points |
| HTF | Regime + Aligned / Divergent status |
| DATA | Mode, Decay half-life, Matrix tier, Sample N |
Position is configurable across 9 chart corners. Text size: Tiny / Small / Normal / Large. Default Tiny so the full 30-row layout fits on any chart without scrolling. Background and text colors flip between Dark and Light display modes.
🟦 COLOR THEMES
Ten cohesive palettes tuned to the Apex design system, each defining three regime axes (Bull, Bear, Sideways):
| Theme | Character | Bull | Bear | Sideways |
|---|---|---|---|---|
| Focus (default) | Modern | Cyan | Deep orange | Cool blue-grey |
| Prism | Classic | Forest green | Crimson | Slate grey |
| Solar | Warm | Amber | Indigo red | Lavender grey |
| Frost | Cool | Sky blue | Soft lavender | Pale steel |
| Laser | Neon | Lime green | Hot crimson | Charcoal grey |
| Aurora | Bright | Gold | Scarlet | Warm beige |
| Plasma | Electric | Aqua | Magenta | Slate teal |
| Bloom | Soft | Mint | Hot pink | Blue-grey |
| Eclipse | Deep | Navy | Dark crimson | Steel grey |
| Carbon | Minimal | Near-white | Mid-grey | Dark grey |
One theme selection drives every visual component: oscillator line, signal line, reference levels, ribbon, fill, glow signals, forecast cone, and all dashboard cells.
Dark / Light Display Mode
Dashboard chrome (background, foreground, borders, section dividers) flips between dark-on-bright and bright-on-dark. The regime axis colors remain consistent across modes — only the panel chrome changes.
🟦 ALERT SYSTEM
Seven alert conditions, each independently togglable:
| Alert | Condition |
|---|---|
| Bull Regime Entry | Regime flipped to BULL (after Min Hold confirmation) |
| Bear Regime Entry | Regime flipped to BEAR (after Min Hold confirmation) |
| Sideways Regime Entry | Regime flipped to SIDEWAYS (default OFF) |
| High Confidence | confidence ≥ 2.5× threshold, first bar of crossing |
| Pending Regime | Inside Sideways, log return ≥ 70 % of either boundary (default OFF) |
| MTF Confluence | Bull / Bear entry + HTF agrees |
| Signal Cross | Main oscillator crosses signal line (default OFF) |
All alerts fire on confirmed bar close. Entry alerts respect the Min Hold filter — a new regime must persist Min Hold bars before its entry alert fires, matching the on-chart glow markers.
The Signal Cross alert can be optionally filtered by HTF alignment (Multi-Timeframe → Filter Signal Cross by HTF). The filter is automatically bypassed when HTF Confluence is globally OFF, so enabling the filter without HTF doesn't silently kill the alert.
🟦 SETTINGS REFERENCE
Theme
- Theme — One of 10 Apex palettes. Default: Focus
- Display Mode — Dark / Light. Default: Dark
Regime Logic
- Threshold Mode — Adaptive (k·σ·√N) / Fixed (%). Default: Adaptive
- Lookback Window — Bars for the rolling log return. Default: 20
- Adaptive k — Sigma multiplier. Default: 1.5
- Fixed Bull Threshold — Used only in Fixed mode. Default: 5.0 %
- Fixed Bear Threshold — Used only in Fixed mode. Default: 5.0 %
- Volatility Window — Bars for the per-bar stdev. Default: 100
- Min Hold — Bars a new regime must persist for entry alerts and glow markers. Default: 4
- Drift-Adjusted Log Returns — Toggle the drift adjustment. Default: ON
- Drift Window — Bars for the long-term mean drift estimate. Default: 250
- Require Momentum Agreement — Velocity sign filter on regime classification. Default: OFF
Bayesian Math
- EWMA Transition Counts (Decay) — Toggle exponential decay. Default: ON
- Decay Half-Life — Bars after which an old count weighs half. Default: 500
- Semi-Markov Duration Conditioning — Toggle the Young / Mature split. Default: ON
- Age Median — Boundary between Young and Mature regimes. Default: 10
- Bayesian Credible Intervals (95 %) — Toggle CI display in the dashboard. Default: ON
Forecast
- Forecast Cone Horizon — Number of bars projected by matrix iteration. Default: 5
- Show Forecast Cone — Toggle the in-panel cone polyline. Default: ON
Oscillator
- Show Signal Line — Toggle the smoothed signal overlay. Default: ON
- Signal Smoothing Method — EMA / HMA / ALMA / SMA. Default: EMA
- Signal Smoothing Length — Window length. Default: 5
- Velocity Window — Bars for the rate-of-change measurement. Default: 5
- Oscillator Line Width — Pixels. Default: 2
Display
- Show Regime Ribbon — Toggle the panel background tint. Default: ON
- Show Gradient Fill — Toggle the oscillator-vs-zero fill. Default: ON
- Show Reference Levels — Toggle the ±100 / ±70 / 0 horizontal lines. Default: ON
- Show Regime Change Glow — Toggle the three-layer halo markers. Default: ON
Multi-Timeframe
- Enable HTF Confluence — Toggle. Default: ON
- HTF Resolution — Higher timeframe. Default: D
- Filter Signal Cross by HTF Alignment — Conditional filter on cross alert. Default: OFF
Dashboard
- Show Status Dashboard — Toggle. Default: ON
- Position — Nine chart corners. Default: Top Right
- Size — Tiny / Small / Normal / Large. Default: Tiny
Alerts
- Bull / Bear / Sideways Regime Entry — Independent toggles
- High Confidence (≥ 2.5×) — Default: ON
- Pending Regime — Default: OFF
- MTF Confluence — Default: ON
- Signal Cross — Default: OFF
🟦 COMPATIBILITY
Works on all asset classes and all timeframes in TradingView Pine Script v6.
- Crypto: Spot, futures, perpetual contracts
- Forex: All pairs
- Equities: Stocks, ETFs, indices
- Commodities: Metals, energy, agriculture
- Timeframes: 1m through Monthly
The adaptive threshold normalises by per-bar realised volatility, and the drift adjustment normalises by the asset's long-run mean drift — together making the regime classification volatility-and-drift-agnostic across assets without manual recalibration. The same default settings work on BTCUSDT daily, SPY weekly, and EURUSD 4H — only the HTF resolution input should be adjusted to match the chart timeframe.
🟦 TECHNICAL NOTES
- Pine Script v6
- `max_labels_count = 500`, `max_lines_count = 500`, `max_bars_back = 5000`
- No repainting — all regime classifications are computed on confirmed bar close. The HTF request uses `lookahead = barmerge.lookahead_off` and `gaps = barmerge.gaps_off`
- Transition counting uses `barstate.isconfirmed` to avoid double-counting the live bar
- Regime change debouncing uses `ta.barssince` to avoid runtime-indexed history reads (which can trip "cannot determine max_bars_back" in Pine v6)
- Heavy computation (P matrix construction, N-step iteration, Bayesian CI math, stationary distribution power iteration, dashboard rendering) is gated on `barstate.islast` to run once per chart render
- Matrix multiplication is implemented as unrolled single-line expressions over a flat 9-cell array for portability and speed
- EWMA decay multiplies all 9 cells of all 3 matrices (counts, countsYoung, countsMature) once per confirmed bar — O(27) per bar overhead
- Dirichlet smoothing prevents NaN propagation when a regime has not appeared in visible history — empty rows fall back to uniform 1/3
- Duration buckets classify by the SOURCE regime's age at the moment of transition (`regAge[1]`), so the bucketing reflects the regime that was about to transition rather than the destination
- `ta.crossover` / `ta.crossunder` are computed at global scope every bar to satisfy Pine's stateful-series rule (the gated cross events read from the cached values)
- Dashboard is rendered with `force_overlay = true` on the main price chart — keeps the oscillator panel free of UI clutter
- Reference-level dashed lines use `line.new()` with `style = line.style_dashed` and `extend = extend.both` for pixel-stable rendering at any zoom
🟦 LIMITATIONS — READ THIS
This indicator is statistically honest about what it can and cannot do. Four known limitations:
1. The Markov assumption is partially violated. Markets are not memoryless. The semi-Markov Young / Mature split mitigates this but does not eliminate it. EWMA decay further mitigates by down-weighting ancient transitions, but a truly path-dependent process (one where the SEQUENCE of recent regimes matters, not just the last one) is not captured.
2. Forward probabilities are not predictions. They are conditional probabilities under the chain assumption with the credible intervals quantifying the SAMPLING uncertainty around them. A "Bull 58 % at +5 bars" reading does not mean "58 % chance the next 5 bars are bullish" — it means "given a long-run sample of similar starting states and the active EWMA-decayed transition matrix, 58 % were in Bull at +5 bars". Use the cone as ONE input alongside other analysis.
3. The regime label lags by N bars. This is structural — the rolling log return necessarily looks back. The Pending early warning and the optional Momentum Filter partially mitigate this but cannot eliminate the lag. Treat the official regime change as a confirmation, not a leading signal.
4. Forecast cone reliability decays with horizon. By +5 bars the cone is at the edge of usefulness; by +20 bars it collapses toward the stationary distribution and carries no additional information beyond π. The default horizon is 5 bars for this reason. Do not over-interpret the right side of the cone.
🟦 DISCLAIMER
This indicator is provided for educational and informational purposes only. It does not constitute financial advice. Past performance does not guarantee future results. The forward probabilities are conditional estimates derived from historical transition counts under a (semi-)Markov model assumption — they are NOT guarantees about future market behaviour. Always conduct your own analysis and apply proper risk management.
The indicator integrates nine analytical layers — drift-adjusted classification, adaptive k·σ·√N threshold, EWMA-decayed transition matrix, semi-Markov duration conditioning, N-bar forecast cone via matrix iteration, Bayesian credible intervals, stationary distribution, velocity precursor with optional momentum filter, and multi-timeframe confluence — each rendered on a single oscillator panel through reference levels, a regime ribbon, gradient fill, three-layer neon glow signals, and an in-panel forecast polyline. A 30-row PRO status dashboard rendered on the main price chart (not the oscillator panel) reports every readout in real time.
Built with mathematical honesty. Every +1 forward probability carries a 95 % Dirichlet-posterior credible interval, the EWMA half-life is user-set so the model can adapt as market character evolves (2020 ≠ 2024), the semi-Markov split splits the chain on regime age so mature trends are not treated like young ones, and the documentation is explicit about what the model can and cannot predict.
🟦 HOW THE CORE ENGINE WORKS
Regime Classification
Each bar, the engine measures the rolling N-bar log return — optionally adjusted for the long-term drift of the asset:
logRet_raw = log(close / close[N])
meanDrift = SMA(log(close / close[1]), driftWin)
logRet = logRet_raw − N × meanDrift (when Drift Adjustment is ON)
The bar is labelled by comparing this return against the configured boundary:
- `logRet > +threshold` → BULL
- `logRet < −threshold` → BEAR
- otherwise → SIDEWAYS
The classification runs every bar with no look-ahead. When the optional Momentum Filter is enabled, the Bull / Bear labels additionally require the oscillator velocity to agree with the direction — killing late entries on exhausted moves.
Adaptive Threshold (k · σ · √N)
Traditional Markov regime indicators use a fixed percentage cut — e.g. "±5 % over 20 bars". This collapses on real markets: the same 5 % is trivial in a 2017 mania and never reached in 2023 chop. The fix is to scale the boundary with realised volatility:
threshold_adaptive = k × σ × √N
where σ is the per-bar log-return standard deviation over a configurable window (default 100 bars). Under a random walk, k = 1.0 cuts at the 16th / 84th percentiles; k = 2.0 at the 2.5th / 97.5th percentiles. The default k = 1.5 reproduces classic ±1.5-sigma thresholds.
Fixed-percentage mode is still available for users who want to lock the threshold deliberately.
Drift Adjustment (Alpha-Adjusted Classification)
Strong-trending markets (long BTC bull runs, persistently uptrending equity indices) carry a non-zero baseline drift. Without adjustment, the rolling log return systematically exceeds zero in such markets — producing excessive Bull-regime flips that reflect baseline drift rather than incremental kinetic energy.
The fix is to subtract the long-term mean drift before threshold comparison:
logRet_excess = log(close / close[N]) − N × mean(log returns, driftWin)
Log returns become EXCESS returns over the asset's own long-run drift — what quant desks call "alpha-adjusted" classification. The default 250-bar drift window approximates one trading year on the daily timeframe.
Oscillator Value
The classified log return is normalised by the active threshold and scaled to ±100 = boundary, clipped at ±300:
oscVal = clip( logRet / threshold × 100, ±300 )
The oscillator value is the central panel signal. Reference levels at ±100 (solid) mark the official regime boundaries, ±70 (dashed) mark the pending early-warning zone, and 0 (dashed) is the neutral midline.
Regime Confidence
Once classified, the move's strength is normalised relative to the active boundary:
confidence = |logRet| / threshold
| Confidence | Tier | Visual |
|---|---|---|
| < 1.0× | weak | ▱▱▱ |
| 1.0× – 2.0× | moderate | ▰▱▱ |
| 2.0× – 3.0× | strong | ▰▰▱ |
| ≥ 3.0× | stretched | ▰▰▰ |
The confidence value feeds the High Confidence alert (≥ 2.5× trigger) and is reported in the Status dashboard.
🟦 EWMA DECAY ON TRANSITION COUNTS
The Ancient-History Problem
A classic Markov chain counts every historical transition with equal weight — a Bull→Bear flip from five years ago contributes the same as one from yesterday. This breaks when market character changes: the 2020 COVID crash regime dynamics are not the same as 2024 retail mania, but a vanilla counter weighs them identically.
The Refinement (EWMA / RiskMetrics-style decay)
Markov Regime Oscillator PRO applies exponential decay to the transition counts every confirmed bar BEFORE incrementing for the new transition:
decayFactor = 0.5 ^ (1 / halfLife)
counts[k] = counts[k] × decayFactor (all 9 cells, every bar)
counts[idx] = counts[idx] + 1.0 (new transition)
After `halfLife` bars, an old count weighs HALF its original. This is the same math RiskMetrics uses for EWMA volatility — adapted here to regime transition memory.
| Half-life | Behaviour |
|---|---|
| 50 – 200 | highly reactive — adapts fast, probabilities noisy |
| 300 – 700 | balanced (default 500) |
| 1000+ | stable — slow adaptation, smooth probabilities |
The decay is applied to all three matrices in lockstep (full, young, mature) so the semi-Markov split below stays internally consistent.
🟦 SEMI-MARKOV DURATION CONDITIONING
The Memoryless Problem
A standard Markov chain says: "Given I'm in Bull, the probability of staying Bull tomorrow is X — regardless of whether Bull started yesterday or 200 bars ago." This is the memoryless property, and on real markets it's wrong. A 200-bar-old Bull regime carries different mean-reversion risk than a 5-bar-old one.
The Refinement
Markov Regime Oscillator PRO additionally builds two CONDITIONAL transition matrices:
- `P_young` — transitions counted when the source regime's age was below the Age Median input
- `P_mature` — transitions counted when the source regime's age was at or above the Age Median
Both matrices are constructed in parallel with the unconditional matrix, using the same per-bar bucketing logic, the same EWMA decay, and the same Dirichlet smoothing.
The active forecast then uses the matrix matching the CURRENT regime's tier — Young or Mature. A 5-bar-old Bull is statistically more likely to continue than a 50-bar-old one; semi-Markov captures this empirically without leaking into the unconditional chain.
The active matrix tier is reported live in the Status dashboard's "Matrix" cell.
🟦 N-BAR FORECAST CONE
Matrix Iteration
The 3×3 transition matrix P encodes one-bar-ahead probabilities. To project further out, the state vector is iterated through P:
s_0 = [P(Side), P(Bull), P(Bear)] = unit vector on current regime
s_{k+1} = s_k · P (matrix multiplication)
For each step k = 1 … forecastSteps, the iteration produces the probability of each regime at that future bar.
Expected Oscillator Value
At each forecast step, the expected oscillator value is computed as:
E[osc | k] = 100 · ( P(Bull | k) − P(Bear | k) )
This number is +100 when the model expects pure Bull, −100 when pure Bear, and ~0 when Side.
In-Panel Polyline
The cone is rendered as a colored polyline extending PAST the last confirmed bar into the future, drawn via `line.new()` so segments are pixel-stable on any chart zoom. Each segment is colored by the dominant regime at that step (Bull / Bear / Side).
Honest Limitation
The cone is reliable up to ~5 bars; beyond that the iteration converges toward the stationary distribution and the forecast loses information. The default Forecast Horizon is 5 bars — covers the meaningful window without illusion.
The forecast is matrix-implied, not a momentum extrapolation. If the oscillator is currently at +250 (strong Bull) but the matrix says P(Bull → Side) is high, the cone will regress to the matrix-implied expected value — showing a visual "cliff" at step 1. This is mathematically honest, not a bug.
The dashboard's "HORIZON +N" cell reports the dominant regime at the terminal forecast step plus its probability — for a single-glance read of where the chain expects to be at horizon end.
🟦 BAYESIAN CREDIBLE INTERVALS
Why Ranges, Not Point Estimates
A forecast like "P(Bull) +1 = 75 %" carries hidden uncertainty. With only 30 historical Bull-source transitions, the true probability could plausibly be anywhere between 55 % and 90 %. With 2000 historical Bull-source transitions, the same 75 % is tightly bracketed at, say, 73 – 77 %.
Reporting a single number hides the difference. Hedge-fund and academic forecasts always carry uncertainty bands; this oscillator does the same.
The Derivation (Dirichlet Posterior, Gaussian Approximation)
The transition matrix posterior is Dirichlet(α + counts) with Laplace (α = 1) prior. Each marginal is Beta with parameters (α_i, Σα − α_i). The Gaussian approximation to that Beta gives:
mean = α_i / Σα
var = α_i · (Σα − α_i) / ( Σα² · (Σα + 1) )
95 % CI ≈ mean ± 1.96 · √var
The CI is computed for the +1 row (the most actionable forecast) and clipped to [0, 1].
Reading the Dashboard
P(Bull) +1 75 % [68 – 82]
| CI Width | Interpretation |
|---|---|
| Narrow (e.g. 73 – 77) | large sample, robust estimate, trust the call |
| Wide (e.g. 50 – 95) | small sample, fragile estimate, don't bet the desk |
This is the difference between a quantitative estimate and an indicator guess.
🟦 STATIONARY DISTRIBUTION π
Power-iterating the matrix to convergence yields the stationary distribution — the long-run probability of being in each regime, independent of the current state. With 50 iterations on a well-behaved stochastic matrix, the distribution is essentially converged.
π(Side) + π(Bull) + π(Bear) = 1.0
The dashboard's "STATIONARY π" section reports each component. Reading π reveals the asset's structural bias regardless of the current regime — e.g., π(Bull) = 55 % on BTC daily tells you the market spends a majority of its time in Bull regimes over the long run, which is fundamentally different from a sideways-grinding instrument with π(Side) = 60 %.
The stationary distribution also serves as the asymptote of the forecast cone: as k → ∞, the cone collapses to π.
🟦 VELOCITY PRECURSOR & MOMENTUM FILTER
Velocity Definition
The oscillator velocity is the N-bar rate-of-change of the oscillator value:
velocity = oscVal − oscVal[velocityWin]
velocityThr = VELOCITY_BASE · √(velocityWin / 5)
The threshold auto-scales with the window so the accel / decel / flat labels stay meaningful at any setting.
Early-Warning Cue
Velocity flips direction BEFORE the official ±100 boundary is crossed — it is a leading indicator of regime change. The Status dashboard's "Velocity" cell displays:
- ↑ accelerating (velocity > +threshold) — colored bull
- ↓ decelerating (velocity < −threshold) — colored bear
- ═ flat — neutral
This partially mitigates the inherent lookback lag of threshold-based regime detection.
Optional Momentum Filter
When the Momentum Filter is enabled, regime classification additionally requires velocity sign agreement:
Bull → logRet > +threshold AND velocity > 0
Bear → logRet < −threshold AND velocity < 0
This kills late-entry signals where price has extended past the threshold but momentum is already exhausted — a classic source of false signals at trend tops/bottoms. Reduces signal count, raises signal quality. Recommended for swing trading, optional for scalping.
🟦 PENDING-REGIME EARLY WARNING
Because the regime is classified from `log(close / close[N])`, the official regime label inherently lags. This is structural, not a bug, but can be partially mitigated.
Inside Sideways, when the log return reaches 70 % of either boundary, the dashboard fires an early-warning cue:
distance_fraction = max(|logRet| / threshold, ...)
isPending = (regime == SIDE) AND (distance_fraction ≥ 0.70)
The Status panel's "Pending" cell displays the direction the return is leaning toward and the current fraction:
⚠ ▲ BULL 87 %
Color matches the leaning regime. The Pending Regime alert (default OFF, opt-in) fires on the first bar a pending state is entered.
This is not a regime change signal — it's a "watch this" cue, triggered roughly 30 % before the official threshold is crossed. Used alongside the official regime change, it gives the user advance notice without compromising the threshold's strictness.
🟦 SELECTABLE SIGNAL SMOOTHING
A second smoothed signal line overlays the main oscillator. Crossovers between the main and signal lines mark momentum-of-regime shifts — these often precede actual regime changes by 1-3 bars.
Four smoothing algorithms are available:
| Method | Character |
|---|---|
| EMA (default) | Exponential — classic lag/smoothness |
| HMA | Hull — near-zero lag for short windows |
| ALMA | Arnaud Legoux (0.85, 6.0) — Gaussian-weighted, smoothest |
| SMA | Simple — most stable, most lag |
The Signal Cross alert can be optionally filtered by HTF alignment — when enabled, the alert fires only when LTF and HTF regimes match. Filter is auto-bypassed when HTF Confluence is globally OFF (silent-kill protection).
🟦 MULTI-TIMEFRAME CONFLUENCE
The same regime logic runs on a user-configured higher timeframe via `request.security` with `lookahead = barmerge.lookahead_off` and `gaps = barmerge.gaps_off` (anti-repaint mandatory). The result is reported in the Status dashboard's HTF block:
| State | Display | Color |
|---|---|---|
| HTF regime matches LTF regime | ✓ ALIGNED | bull |
| HTF regime differs from LTF | ⚠ DIVERGENT | bear |
| Insufficient HTF data | — | foreground |
Divergent regimes are common at trend turns — the LTF flips before the HTF catches up. Aligned regimes carry higher conviction. A separate alert ("MTF Confluence") fires on regime entries only when the HTF agrees.
Recommended pairings:
| Chart | HTF |
|---|---|
| 15m | 1H |
| 1H | D |
| 4H | W |
| D | W |
| W | M |
Use at least 3× your chart timeframe — anything closer and the two regimes track each other with no information gain.
🟦 OSCILLATOR PANEL VISUAL LAYER
Main Oscillator Line
The oscillator value plotted as a continuous line with five color tiers reflecting regime strength:
| Range | Color |
|---|---|
| ≥ +100 | full Bull |
| +70 to +100 | dim Bull (pending up) |
| −70 to +70 | neutral Side |
| −100 to −70 | dim Bear (pending down) |
| ≤ −100 | full Bear |
Line width is configurable 1 – 5 pixels.
Signal Line
A smoothed overlay of the main oscillator, faded foreground color, single-pixel width. Drives the Signal Cross alert and the dashboard Signal cell.
Reference Levels
Three horizontal levels per panel side:
- ±100 — official regime boundaries (solid plot line)
- ±70 — pending early-warning zones (dashed `line.new`)
- 0 — neutral midline (dashed `line.new`)
The dashed lines use `line.new()` rather than `plot.style_circles` so they remain pixel-stable at any chart zoom — they will NOT rescale or fragment.
Regime Ribbon
The oscillator panel background is tinted to the current regime color at 20 % opacity. Provides instant regime context at a glance — Bull / Bear / Side periods are visually separated even when zoomed out on long history. Toggleable.
Gradient Fill
The area between the oscillator line and zero is filled in the regime color, with intensity scaling adaptively by distance from zero — stronger color = higher conviction. Empty at zero.
Three-Layer Neon Glow Signals
On every confirmed regime transition (after the Min Hold filter passes), the indicator drops a three-layer halo on the oscillator line:
| Layer | Size | Transparency | Purpose |
|---|---|---|---|
| Outer | size.large | 80 % | Soft halo |
| Middle | size.normal | 50 % | Mid-glow |
| Core | size.small | 0 % | Bright center |
Bull entries (▲ triangle up), Bear entries (▼ triangle down), and Side entries (◆ diamond). The Min Hold input (default 4 bars) requires a new regime to persist before its flip is drawn — kills label spam in choppy zones without affecting the underlying transition counts.
Forecast Cone Polyline
On the last confirmed bar, a colored polyline extends into the future for N bars, plotting the expected oscillator value at each step. Color reflects the dominant regime at that step. Drawn with `line.new()` so segments are pixel-stable; recomputed on every chart refresh.
🟦 PRO STATUS DASHBOARD
A single dashboard rendered on the MAIN PRICE CHART (not the oscillator panel) via `force_overlay = true`. This keeps the oscillator panel uncluttered so the oscillator line, signal line, gradient fill, and forecast cone get the full pane height.
The dashboard is structured in seven sections, all theme-aware:
| Section | Cells |
|---|---|
| REGIME | Regime, Age + tier, Confidence, Pending, Velocity |
| FORECAST +1 | P(Bull), P(Bear), P(Side) — each with 95 % CI |
| HORIZON +N | Dominant regime at terminal forecast step + probability |
| STATIONARY π | π(Bull), π(Bear), π(Side) — long-run equilibrium |
| OSCILLATOR | Value, Signal direction, Threshold, Drift basis points |
| HTF | Regime + Aligned / Divergent status |
| DATA | Mode, Decay half-life, Matrix tier, Sample N |
Position is configurable across 9 chart corners. Text size: Tiny / Small / Normal / Large. Default Tiny so the full 30-row layout fits on any chart without scrolling. Background and text colors flip between Dark and Light display modes.
🟦 COLOR THEMES
Ten cohesive palettes tuned to the Apex design system, each defining three regime axes (Bull, Bear, Sideways):
| Theme | Character | Bull | Bear | Sideways |
|---|---|---|---|---|
| Focus (default) | Modern | Cyan | Deep orange | Cool blue-grey |
| Prism | Classic | Forest green | Crimson | Slate grey |
| Solar | Warm | Amber | Indigo red | Lavender grey |
| Frost | Cool | Sky blue | Soft lavender | Pale steel |
| Laser | Neon | Lime green | Hot crimson | Charcoal grey |
| Aurora | Bright | Gold | Scarlet | Warm beige |
| Plasma | Electric | Aqua | Magenta | Slate teal |
| Bloom | Soft | Mint | Hot pink | Blue-grey |
| Eclipse | Deep | Navy | Dark crimson | Steel grey |
| Carbon | Minimal | Near-white | Mid-grey | Dark grey |
One theme selection drives every visual component: oscillator line, signal line, reference levels, ribbon, fill, glow signals, forecast cone, and all dashboard cells.
Dark / Light Display Mode
Dashboard chrome (background, foreground, borders, section dividers) flips between dark-on-bright and bright-on-dark. The regime axis colors remain consistent across modes — only the panel chrome changes.
🟦 ALERT SYSTEM
Seven alert conditions, each independently togglable:
| Alert | Condition |
|---|---|
| Bull Regime Entry | Regime flipped to BULL (after Min Hold confirmation) |
| Bear Regime Entry | Regime flipped to BEAR (after Min Hold confirmation) |
| Sideways Regime Entry | Regime flipped to SIDEWAYS (default OFF) |
| High Confidence | confidence ≥ 2.5× threshold, first bar of crossing |
| Pending Regime | Inside Sideways, log return ≥ 70 % of either boundary (default OFF) |
| MTF Confluence | Bull / Bear entry + HTF agrees |
| Signal Cross | Main oscillator crosses signal line (default OFF) |
All alerts fire on confirmed bar close. Entry alerts respect the Min Hold filter — a new regime must persist Min Hold bars before its entry alert fires, matching the on-chart glow markers.
The Signal Cross alert can be optionally filtered by HTF alignment (Multi-Timeframe → Filter Signal Cross by HTF). The filter is automatically bypassed when HTF Confluence is globally OFF, so enabling the filter without HTF doesn't silently kill the alert.
🟦 SETTINGS REFERENCE
Theme
- Theme — One of 10 Apex palettes. Default: Focus
- Display Mode — Dark / Light. Default: Dark
Regime Logic
- Threshold Mode — Adaptive (k·σ·√N) / Fixed (%). Default: Adaptive
- Lookback Window — Bars for the rolling log return. Default: 20
- Adaptive k — Sigma multiplier. Default: 1.5
- Fixed Bull Threshold — Used only in Fixed mode. Default: 5.0 %
- Fixed Bear Threshold — Used only in Fixed mode. Default: 5.0 %
- Volatility Window — Bars for the per-bar stdev. Default: 100
- Min Hold — Bars a new regime must persist for entry alerts and glow markers. Default: 4
- Drift-Adjusted Log Returns — Toggle the drift adjustment. Default: ON
- Drift Window — Bars for the long-term mean drift estimate. Default: 250
- Require Momentum Agreement — Velocity sign filter on regime classification. Default: OFF
Bayesian Math
- EWMA Transition Counts (Decay) — Toggle exponential decay. Default: ON
- Decay Half-Life — Bars after which an old count weighs half. Default: 500
- Semi-Markov Duration Conditioning — Toggle the Young / Mature split. Default: ON
- Age Median — Boundary between Young and Mature regimes. Default: 10
- Bayesian Credible Intervals (95 %) — Toggle CI display in the dashboard. Default: ON
Forecast
- Forecast Cone Horizon — Number of bars projected by matrix iteration. Default: 5
- Show Forecast Cone — Toggle the in-panel cone polyline. Default: ON
Oscillator
- Show Signal Line — Toggle the smoothed signal overlay. Default: ON
- Signal Smoothing Method — EMA / HMA / ALMA / SMA. Default: EMA
- Signal Smoothing Length — Window length. Default: 5
- Velocity Window — Bars for the rate-of-change measurement. Default: 5
- Oscillator Line Width — Pixels. Default: 2
Display
- Show Regime Ribbon — Toggle the panel background tint. Default: ON
- Show Gradient Fill — Toggle the oscillator-vs-zero fill. Default: ON
- Show Reference Levels — Toggle the ±100 / ±70 / 0 horizontal lines. Default: ON
- Show Regime Change Glow — Toggle the three-layer halo markers. Default: ON
Multi-Timeframe
- Enable HTF Confluence — Toggle. Default: ON
- HTF Resolution — Higher timeframe. Default: D
- Filter Signal Cross by HTF Alignment — Conditional filter on cross alert. Default: OFF
Dashboard
- Show Status Dashboard — Toggle. Default: ON
- Position — Nine chart corners. Default: Top Right
- Size — Tiny / Small / Normal / Large. Default: Tiny
Alerts
- Bull / Bear / Sideways Regime Entry — Independent toggles
- High Confidence (≥ 2.5×) — Default: ON
- Pending Regime — Default: OFF
- MTF Confluence — Default: ON
- Signal Cross — Default: OFF
🟦 COMPATIBILITY
Works on all asset classes and all timeframes in TradingView Pine Script v6.
- Crypto: Spot, futures, perpetual contracts
- Forex: All pairs
- Equities: Stocks, ETFs, indices
- Commodities: Metals, energy, agriculture
- Timeframes: 1m through Monthly
The adaptive threshold normalises by per-bar realised volatility, and the drift adjustment normalises by the asset's long-run mean drift — together making the regime classification volatility-and-drift-agnostic across assets without manual recalibration. The same default settings work on BTCUSDT daily, SPY weekly, and EURUSD 4H — only the HTF resolution input should be adjusted to match the chart timeframe.
🟦 TECHNICAL NOTES
- Pine Script v6
- `max_labels_count = 500`, `max_lines_count = 500`, `max_bars_back = 5000`
- No repainting — all regime classifications are computed on confirmed bar close. The HTF request uses `lookahead = barmerge.lookahead_off` and `gaps = barmerge.gaps_off`
- Transition counting uses `barstate.isconfirmed` to avoid double-counting the live bar
- Regime change debouncing uses `ta.barssince` to avoid runtime-indexed history reads (which can trip "cannot determine max_bars_back" in Pine v6)
- Heavy computation (P matrix construction, N-step iteration, Bayesian CI math, stationary distribution power iteration, dashboard rendering) is gated on `barstate.islast` to run once per chart render
- Matrix multiplication is implemented as unrolled single-line expressions over a flat 9-cell array for portability and speed
- EWMA decay multiplies all 9 cells of all 3 matrices (counts, countsYoung, countsMature) once per confirmed bar — O(27) per bar overhead
- Dirichlet smoothing prevents NaN propagation when a regime has not appeared in visible history — empty rows fall back to uniform 1/3
- Duration buckets classify by the SOURCE regime's age at the moment of transition (`regAge[1]`), so the bucketing reflects the regime that was about to transition rather than the destination
- `ta.crossover` / `ta.crossunder` are computed at global scope every bar to satisfy Pine's stateful-series rule (the gated cross events read from the cached values)
- Dashboard is rendered with `force_overlay = true` on the main price chart — keeps the oscillator panel free of UI clutter
- Reference-level dashed lines use `line.new()` with `style = line.style_dashed` and `extend = extend.both` for pixel-stable rendering at any zoom
🟦 LIMITATIONS — READ THIS
This indicator is statistically honest about what it can and cannot do. Four known limitations:
1. The Markov assumption is partially violated. Markets are not memoryless. The semi-Markov Young / Mature split mitigates this but does not eliminate it. EWMA decay further mitigates by down-weighting ancient transitions, but a truly path-dependent process (one where the SEQUENCE of recent regimes matters, not just the last one) is not captured.
2. Forward probabilities are not predictions. They are conditional probabilities under the chain assumption with the credible intervals quantifying the SAMPLING uncertainty around them. A "Bull 58 % at +5 bars" reading does not mean "58 % chance the next 5 bars are bullish" — it means "given a long-run sample of similar starting states and the active EWMA-decayed transition matrix, 58 % were in Bull at +5 bars". Use the cone as ONE input alongside other analysis.
3. The regime label lags by N bars. This is structural — the rolling log return necessarily looks back. The Pending early warning and the optional Momentum Filter partially mitigate this but cannot eliminate the lag. Treat the official regime change as a confirmation, not a leading signal.
4. Forecast cone reliability decays with horizon. By +5 bars the cone is at the edge of usefulness; by +20 bars it collapses toward the stationary distribution and carries no additional information beyond π. The default horizon is 5 bars for this reason. Do not over-interpret the right side of the cone.
🟦 DISCLAIMER
This indicator is provided for educational and informational purposes only. It does not constitute financial advice. Past performance does not guarantee future results. The forward probabilities are conditional estimates derived from historical transition counts under a (semi-)Markov model assumption — they are NOT guarantees about future market behaviour. Always conduct your own analysis and apply proper risk management.

免責事項
これらの情報および投稿は、TradingViewが提供または承認する金融、投資、取引、またはその他の種類の助言もしくは推奨であることを意図したものではなく、またこれらに該当するものでもありません。詳細は利用規約をご覧ください。
免責事項
これらの情報および投稿は、TradingViewが提供または承認する金融、投資、取引、またはその他の種類の助言もしくは推奨であることを意図したものではなく、またこれらに該当するものでもありません。詳細は利用規約をご覧ください。