CRSM v1.8 - Currency Relative Strength Monitor
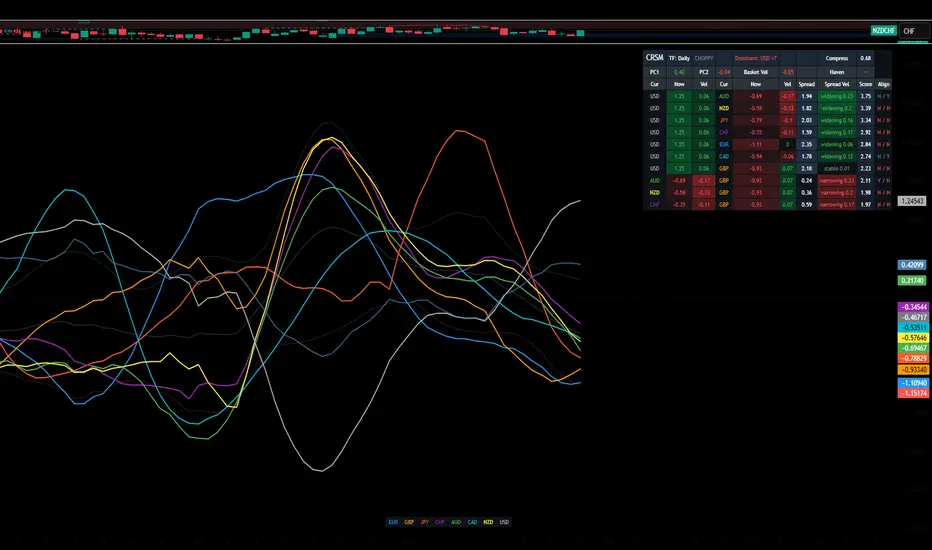
CRSM ranks all 28 major FX pairs by activity in real time and surfaces the top 10, so you can focus on the 2–3 worth watching closely. It works by measuring each currency's strength against the trade-weighted basket of eight majors — turning a 28-chart problem into a one-glance dashboard.
This is a dashboard, not a signal generator. It narrows your attention; the decisions to enter, where to place stops, and where to target stay your call, made on the actual pair chart with whatever method you trust.
## How It Works
Every bar, CRSM does three things.
**Measures returns.** For each of the eight currencies, it computes the log return against USD over a lookback window. Log returns are additive across cross rates — log(EUR/JPY) move equals log(EUR/USD) move plus log(USD/JPY) move — so seven USD-anchored prices fully describe all 28 pair returns.
**Centres against the basket.** The eight return values are averaged using BIS turnover-share weighting (USD heaviest, EUR second, NZD lightest). Each currency's return is centred against that average. This puts USD on equal footing — when USD is rallying broadly, USD shows up as strong rather than being the implicit baseline.
**Standardises.** Three sub-measurements — raw momentum, volatility-adjusted momentum, and rolling z-score — are rescaled to a common range and averaged. The result is on a z-score-like scale: ±1 is notable, ±2 is extreme.
Everything else in the indicator is presentation of those numbers.
## Auto-Tuned Per Timeframe
CRSM applies different calibration values depending on the chart's timeframe. Six buckets are defined (1m, 5m, 15m, 1H, 4H, Daily); each picks appropriate values for lookback, smoothing, velocity window, and ranking weights. The dashboard header shows the active bucket (e.g. "TF: 1H") so you always know which profile is in effect. You can drop CRSM onto a 1H chart or a 5m chart and get behaviour appropriate to that TF without retuning.
## What You See
**Chart panel:** eight coloured lines (one per currency), a basket compression line (low = bunched, pre-breakout), a basket mean, ±1σ threshold bands, and a currency-colour legend at the bottom-centre.
**Dashboard (top-right by default):** a compact panel with two sections.
The top section shows basket-level state:
- **Regime** — TRENDING / COMPRESSED / CHOPPY / CRISIS
- **Haven** — RISK-ON / RISK-OFF / neutral (described below)
- **Dominant** — flags when one currency appears in many of the top pairs
- **Compress** — basket dispersion magnitude
- **PC1 / PC2** — macro decomposition (PC1 = USD vs basket, PC2 = commodity bloc vs safe-haven bloc)
- **Basket Vel** — rate of change of average strength
The bottom section is the pair table — 10 rows showing the most active pairs, oriented with the stronger currency on the left. Each row gives both currencies, their individual strengths and velocities, the spread between them, whether the spread is widening or narrowing, and an Activity Score used to rank the rows.
## The Confluent Haven Extreme Detector
The single empirically-validated signal in CRSM, identified via cross-symbol backtest analysis on 8 historical datasets. When two or more of JPY/CHF (the safe-haven bloc) cross beyond ±1.5 strength simultaneously, the indicator flags the risk regime:
- **RISK-ON** — both havens below −1.5. Backtest: non-JPY pairs (GBP/USD, EUR/USD) rallied with 70–88% win rate over the next 20 bars across the test set.
- **RISK-OFF** — both havens above +1.5. Backtest: JPY-quote pairs (AUD/JPY especially) fell with 64% win rate over the next 20 bars across the test set.
When the cell flips, that's a regime context worth reading. The directional bias is set; what to do with it on a specific pair is still your decision on the pair chart. Past backtest results do not guarantee future behaviour.
## The Dominance Flag
When the top 10 pairs are dominated by one currency, the dashboard says so (e.g., "Dominant: USD ×5" means USD appears in 5 of the 10 pairs). This warns that the top list isn't 10 independent trade ideas — it's one underlying theme expressed in multiple correlated ways. The flag shows blue at count 4–5 and red at ≥ 6. Below 4 it stays blank.
## Practical Workflow
A simple 1H swing-trading workflow:
1. **Check the regime first.** COMPRESSED → wait. TRENDING → proceed. CHOPPY → mean-reversion only. CRISIS → reduce size.
2. **Check the Haven cell.** RISK-ON / RISK-OFF sets your bias.
3. **Check the Dominance flag.** If a single currency dominates the top 10, recognise the underlying theme.
4. **Scan the top of the pair table.** High Score plus "widening" Spread Vel marks an active developing setup.
5. **Confirm with PC1 / PC2** if the macro axes align with your read.
6. **Open the actual pair chart and apply your own analysis.** CRSM gets you to which pair. The entry, stop, and target are decisions you make on the pair chart.
7. **Use alerts as awareness, not as entry triggers.**
## Multiple Timeframes
A useful pattern is to run two instances of CRSM on the same chart — a slower one (e.g. 1H) and a faster one (e.g. 5m or 15m). The 1H gives macro context. The 5m/15m shows tactical setups. When the two views agree, the read is high-conviction. When they disagree, the shorter timeframe is usually showing something the longer hasn't absorbed yet.
## Settings
The Settings panel is intentionally compact — TF-dependent parameters are auto-tuned, so most controls are display preferences.
- **Currencies** — turn individual currencies on or off in the basket.
- **Multi-Horizon Strength** — enable a longer-horizon comparison strength used in the analysis.
- **Decomposition Outputs** — toggle PC1 / PC2 plot lines and opacity.
- **Compression & Velocity** — plot toggles (threshold and window are auto).
- **Haven Extreme Detector** — enable, set strength threshold (default 1.5), optional chart-panel tint during haven extreme regimes.
- **Data Source** — OANDA / FOREXCOM / FX_IDC / Futures.
- **Display** — show or hide dashboard elements, dashboard position.
- **Pair Ranking** — number of pairs to display, sort key (Score / Spread Vel / Spread), dashboard text size.
- **Appearance** — colour theme and dark mode.
## Alerts
All alerts fire once on the transition bar, not every bar after:
- **Currency Crossed Upper σ** — any visible currency crossed +1σ
- **Currency Crossed Lower σ** — any visible currency crossed −1σ
- **Compression Release** — basket dispersion just expanded out of compression
- **High-Potential Pair** — top-pair spread exceeded 2× basket dispersion
- **Regime → Compressed / Trending / Crisis** — regime transitions
- **Haven → Risk-On / Risk-Off** — the two haven transitions
## Honest Limitations
**Algebraic completeness ≠ behavioural equivalence.** The 7 USD-anchored prices fully describe all 28 cross-pair returns mathematically. But actual cross-pair behaviour is also affected by pair-specific liquidity, session flow, dealer positioning, and pair-specific volatility clustering. CRSM captures the algebraic structure of FX, not every behavioural nuance. Differences concentrate around news, session opens, and order-flow events.
**Not a timing system.** Strength dynamics give you context, regime read, and pair selection. They don't tell you when to enter or exit a specific trade. Use CRSM alongside your normal chart analysis (structural levels, market structure, indicators you trust) — not in place of it.
**Timeframe behaviour varies.** Even with auto-tune, faster timeframes are inherently noisier and slower timeframes are quieter. The auto-tune calibrates parameters appropriately but cannot change the noise profile of any given TF. The 1m, 4H, and Daily buckets are calibrated from the same scaling logic that backed the 5m / 15m / 1H buckets but have not been independently backtested at the same depth.
**Pair concentration.** When one currency dominates the basket — which is most of the time — the top N pairs cluster around that currency. The Dominance flag warns when this is happening so you don't over-diversify into correlated bets.
---
*Educational tool. Past performance is not indicative of future results. Always combine with independent analysis and your own risk management.*
This is a dashboard, not a signal generator. It narrows your attention; the decisions to enter, where to place stops, and where to target stay your call, made on the actual pair chart with whatever method you trust.
## How It Works
Every bar, CRSM does three things.
**Measures returns.** For each of the eight currencies, it computes the log return against USD over a lookback window. Log returns are additive across cross rates — log(EUR/JPY) move equals log(EUR/USD) move plus log(USD/JPY) move — so seven USD-anchored prices fully describe all 28 pair returns.
**Centres against the basket.** The eight return values are averaged using BIS turnover-share weighting (USD heaviest, EUR second, NZD lightest). Each currency's return is centred against that average. This puts USD on equal footing — when USD is rallying broadly, USD shows up as strong rather than being the implicit baseline.
**Standardises.** Three sub-measurements — raw momentum, volatility-adjusted momentum, and rolling z-score — are rescaled to a common range and averaged. The result is on a z-score-like scale: ±1 is notable, ±2 is extreme.
Everything else in the indicator is presentation of those numbers.
## Auto-Tuned Per Timeframe
CRSM applies different calibration values depending on the chart's timeframe. Six buckets are defined (1m, 5m, 15m, 1H, 4H, Daily); each picks appropriate values for lookback, smoothing, velocity window, and ranking weights. The dashboard header shows the active bucket (e.g. "TF: 1H") so you always know which profile is in effect. You can drop CRSM onto a 1H chart or a 5m chart and get behaviour appropriate to that TF without retuning.
## What You See
**Chart panel:** eight coloured lines (one per currency), a basket compression line (low = bunched, pre-breakout), a basket mean, ±1σ threshold bands, and a currency-colour legend at the bottom-centre.
**Dashboard (top-right by default):** a compact panel with two sections.
The top section shows basket-level state:
- **Regime** — TRENDING / COMPRESSED / CHOPPY / CRISIS
- **Haven** — RISK-ON / RISK-OFF / neutral (described below)
- **Dominant** — flags when one currency appears in many of the top pairs
- **Compress** — basket dispersion magnitude
- **PC1 / PC2** — macro decomposition (PC1 = USD vs basket, PC2 = commodity bloc vs safe-haven bloc)
- **Basket Vel** — rate of change of average strength
The bottom section is the pair table — 10 rows showing the most active pairs, oriented with the stronger currency on the left. Each row gives both currencies, their individual strengths and velocities, the spread between them, whether the spread is widening or narrowing, and an Activity Score used to rank the rows.
## The Confluent Haven Extreme Detector
The single empirically-validated signal in CRSM, identified via cross-symbol backtest analysis on 8 historical datasets. When two or more of JPY/CHF (the safe-haven bloc) cross beyond ±1.5 strength simultaneously, the indicator flags the risk regime:
- **RISK-ON** — both havens below −1.5. Backtest: non-JPY pairs (GBP/USD, EUR/USD) rallied with 70–88% win rate over the next 20 bars across the test set.
- **RISK-OFF** — both havens above +1.5. Backtest: JPY-quote pairs (AUD/JPY especially) fell with 64% win rate over the next 20 bars across the test set.
When the cell flips, that's a regime context worth reading. The directional bias is set; what to do with it on a specific pair is still your decision on the pair chart. Past backtest results do not guarantee future behaviour.
## The Dominance Flag
When the top 10 pairs are dominated by one currency, the dashboard says so (e.g., "Dominant: USD ×5" means USD appears in 5 of the 10 pairs). This warns that the top list isn't 10 independent trade ideas — it's one underlying theme expressed in multiple correlated ways. The flag shows blue at count 4–5 and red at ≥ 6. Below 4 it stays blank.
## Practical Workflow
A simple 1H swing-trading workflow:
1. **Check the regime first.** COMPRESSED → wait. TRENDING → proceed. CHOPPY → mean-reversion only. CRISIS → reduce size.
2. **Check the Haven cell.** RISK-ON / RISK-OFF sets your bias.
3. **Check the Dominance flag.** If a single currency dominates the top 10, recognise the underlying theme.
4. **Scan the top of the pair table.** High Score plus "widening" Spread Vel marks an active developing setup.
5. **Confirm with PC1 / PC2** if the macro axes align with your read.
6. **Open the actual pair chart and apply your own analysis.** CRSM gets you to which pair. The entry, stop, and target are decisions you make on the pair chart.
7. **Use alerts as awareness, not as entry triggers.**
## Multiple Timeframes
A useful pattern is to run two instances of CRSM on the same chart — a slower one (e.g. 1H) and a faster one (e.g. 5m or 15m). The 1H gives macro context. The 5m/15m shows tactical setups. When the two views agree, the read is high-conviction. When they disagree, the shorter timeframe is usually showing something the longer hasn't absorbed yet.
## Settings
The Settings panel is intentionally compact — TF-dependent parameters are auto-tuned, so most controls are display preferences.
- **Currencies** — turn individual currencies on or off in the basket.
- **Multi-Horizon Strength** — enable a longer-horizon comparison strength used in the analysis.
- **Decomposition Outputs** — toggle PC1 / PC2 plot lines and opacity.
- **Compression & Velocity** — plot toggles (threshold and window are auto).
- **Haven Extreme Detector** — enable, set strength threshold (default 1.5), optional chart-panel tint during haven extreme regimes.
- **Data Source** — OANDA / FOREXCOM / FX_IDC / Futures.
- **Display** — show or hide dashboard elements, dashboard position.
- **Pair Ranking** — number of pairs to display, sort key (Score / Spread Vel / Spread), dashboard text size.
- **Appearance** — colour theme and dark mode.
## Alerts
All alerts fire once on the transition bar, not every bar after:
- **Currency Crossed Upper σ** — any visible currency crossed +1σ
- **Currency Crossed Lower σ** — any visible currency crossed −1σ
- **Compression Release** — basket dispersion just expanded out of compression
- **High-Potential Pair** — top-pair spread exceeded 2× basket dispersion
- **Regime → Compressed / Trending / Crisis** — regime transitions
- **Haven → Risk-On / Risk-Off** — the two haven transitions
## Honest Limitations
**Algebraic completeness ≠ behavioural equivalence.** The 7 USD-anchored prices fully describe all 28 cross-pair returns mathematically. But actual cross-pair behaviour is also affected by pair-specific liquidity, session flow, dealer positioning, and pair-specific volatility clustering. CRSM captures the algebraic structure of FX, not every behavioural nuance. Differences concentrate around news, session opens, and order-flow events.
**Not a timing system.** Strength dynamics give you context, regime read, and pair selection. They don't tell you when to enter or exit a specific trade. Use CRSM alongside your normal chart analysis (structural levels, market structure, indicators you trust) — not in place of it.
**Timeframe behaviour varies.** Even with auto-tune, faster timeframes are inherently noisier and slower timeframes are quieter. The auto-tune calibrates parameters appropriately but cannot change the noise profile of any given TF. The 1m, 4H, and Daily buckets are calibrated from the same scaling logic that backed the 5m / 15m / 1H buckets but have not been independently backtested at the same depth.
**Pair concentration.** When one currency dominates the basket — which is most of the time — the top N pairs cluster around that currency. The Dominance flag warns when this is happening so you don't over-diversify into correlated bets.
---
*Educational tool. Past performance is not indicative of future results. Always combine with independent analysis and your own risk management.*

免責事項
これらの情報および投稿は、TradingViewが提供または承認する金融、投資、取引、またはその他の種類の助言もしくは推奨であることを意図したものではなく、またこれらに該当するものでもありません。詳細は利用規約をご覧ください。
免責事項
これらの情報および投稿は、TradingViewが提供または承認する金融、投資、取引、またはその他の種類の助言もしくは推奨であることを意図したものではなく、またこれらに該当するものでもありません。詳細は利用規約をご覧ください。