OPEN-SOURCE SCRIPT
Asia & NY Session Range Table (heistrader)
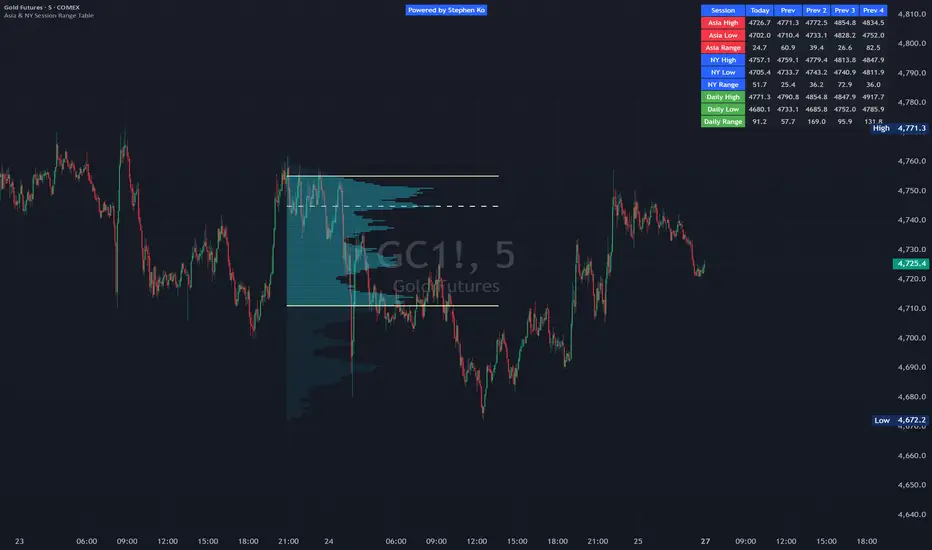
Asia & NY Session Range Table
(heistrader)
Overview
This powerful indicator automatically tracks and displays key price levels from Asia and New York trading sessions, along with daily data and RSI, in a clean, customizable table format. Perfect for traders who want to quickly reference multi-session ranges without manual calculations.
🎯 Key Features
📈 Session Tracking
Asia Session (HKT 06:00-10:00) – Track Asian session High, Low, and Range
NY Session (EST 09:30-16:00) – Track New York session High, Low, and Range
Full Daily Data – Complete day's High, Low, Range, and average RSI
📅 Historical Reference
Shows Today + 4 previous days (Prev, Prev 2, Prev 3, Prev 4)
Automatically shifts data each new trading day
No manual data entry required
🎨 Visual Customization
Color-coded section labels:
🔴 Asia Session – Red background
🔵 NY Session – Blue background
🟢 Daily Data – Green background
RSI color alerts:
🔴 Red text for overbought (≥70)
🟢 Green text for oversold (≤30)
Fully customizable table position, size, and colors
⚙️ Flexible Settings
Toggle individual rows on/off (Asia, NY, Daily, RSI)
Adjustable session times
Customizable RSI length and thresholds
Multiple table positions: Top/Bottom, Left/Right
Table sizes: Tiny, Small, Normal, Large
💡 Why Use This Indicator?
Traditional Method This Indicator
Manual session tracking Automatic session detection
Scrolling through charts Instant table display
Mental calculations Automatic range calculation
Multiple timeframes One consolidated view
🔧 How It Works
Automatically detects when Asia and NY sessions begin/end based on your timezone
Records session High/Low values in real-time
Calculates session ranges and daily RSI averages
Shifts data at each new trading day
Displays all information in a clean table on your chart
📋 Example Use Cases
🏢 Institutional Traders
Quickly identify overnight ranges and potential breakout levels
📉 Day Traders
Reference key support/resistance levels from major sessions
📊 Swing Traders
Track session volatility patterns across multiple days
🔬 Technical Analysts
Compare RSI conditions with price action across sessions
🚀 Quick Start
Add indicator to your chart
Verify timezone setting (default: Asia/Hong_Kong)
Adjust session times if needed
Position table where convenient (default: Top Right)
Toggle rows you want to display
Start trading with instant session data!
⚡ Pro Tips
Volume Confirmation: Use Asia/NY ranges alongside volume indicators
Breakout Strategy: Watch for price breaking beyond previous session ranges
RSI Divergence: Look for price/RSI divergences across daily and session data
Multiple Timeframe: Combine with higher timeframe analysis for confluence
📝 Input Parameters
Parameter Default Description
Timezone Asia/Hong_Kong Your chart's timezone
Asia Session 2200-0200 UTC (HKT 06:00-10:00)
NY Session 1330-2000 UTC (EST 09:30-16:00)
Table Position Top Right Where table appears
Table Size Small Font size
RSI Length 14 Period for RSI calculation
RSI Overbought 70 Threshold for red text
RSI Oversold 30 Threshold for green text
❓ Common Questions
Q: Does this work on any timeframe?
A: Yes! Works on all timeframes from 1min to monthly.
Q: Can I adjust session times?
A: Absolutely – both Asia and NY session times are fully customizable in UTC.
Q: Does it repaint?
A: No. Session values are only finalized after each session closes.
Q: Can I hide certain rows?
A: Yes – each row group has its own visibility toggle.
#heistrader
(heistrader)
Overview
This powerful indicator automatically tracks and displays key price levels from Asia and New York trading sessions, along with daily data and RSI, in a clean, customizable table format. Perfect for traders who want to quickly reference multi-session ranges without manual calculations.
🎯 Key Features
📈 Session Tracking
Asia Session (HKT 06:00-10:00) – Track Asian session High, Low, and Range
NY Session (EST 09:30-16:00) – Track New York session High, Low, and Range
Full Daily Data – Complete day's High, Low, Range, and average RSI
📅 Historical Reference
Shows Today + 4 previous days (Prev, Prev 2, Prev 3, Prev 4)
Automatically shifts data each new trading day
No manual data entry required
🎨 Visual Customization
Color-coded section labels:
🔴 Asia Session – Red background
🔵 NY Session – Blue background
🟢 Daily Data – Green background
RSI color alerts:
🔴 Red text for overbought (≥70)
🟢 Green text for oversold (≤30)
Fully customizable table position, size, and colors
⚙️ Flexible Settings
Toggle individual rows on/off (Asia, NY, Daily, RSI)
Adjustable session times
Customizable RSI length and thresholds
Multiple table positions: Top/Bottom, Left/Right
Table sizes: Tiny, Small, Normal, Large
💡 Why Use This Indicator?
Traditional Method This Indicator
Manual session tracking Automatic session detection
Scrolling through charts Instant table display
Mental calculations Automatic range calculation
Multiple timeframes One consolidated view
🔧 How It Works
Automatically detects when Asia and NY sessions begin/end based on your timezone
Records session High/Low values in real-time
Calculates session ranges and daily RSI averages
Shifts data at each new trading day
Displays all information in a clean table on your chart
📋 Example Use Cases
🏢 Institutional Traders
Quickly identify overnight ranges and potential breakout levels
📉 Day Traders
Reference key support/resistance levels from major sessions
📊 Swing Traders
Track session volatility patterns across multiple days
🔬 Technical Analysts
Compare RSI conditions with price action across sessions
🚀 Quick Start
Add indicator to your chart
Verify timezone setting (default: Asia/Hong_Kong)
Adjust session times if needed
Position table where convenient (default: Top Right)
Toggle rows you want to display
Start trading with instant session data!
⚡ Pro Tips
Volume Confirmation: Use Asia/NY ranges alongside volume indicators
Breakout Strategy: Watch for price breaking beyond previous session ranges
RSI Divergence: Look for price/RSI divergences across daily and session data
Multiple Timeframe: Combine with higher timeframe analysis for confluence
📝 Input Parameters
Parameter Default Description
Timezone Asia/Hong_Kong Your chart's timezone
Asia Session 2200-0200 UTC (HKT 06:00-10:00)
NY Session 1330-2000 UTC (EST 09:30-16:00)
Table Position Top Right Where table appears
Table Size Small Font size
RSI Length 14 Period for RSI calculation
RSI Overbought 70 Threshold for red text
RSI Oversold 30 Threshold for green text
❓ Common Questions
Q: Does this work on any timeframe?
A: Yes! Works on all timeframes from 1min to monthly.
Q: Can I adjust session times?
A: Absolutely – both Asia and NY session times are fully customizable in UTC.
Q: Does it repaint?
A: No. Session values are only finalized after each session closes.
Q: Can I hide certain rows?
A: Yes – each row group has its own visibility toggle.
#heistrader
オープンソーススクリプト
TradingViewの精神に則り、このスクリプトの作者はコードをオープンソースとして公開してくれました。トレーダーが内容を確認・検証できるようにという配慮です。作者に拍手を送りましょう!無料で利用できますが、コードの再公開はハウスルールに従う必要があります。

免責事項
これらの情報および投稿は、TradingViewが提供または承認する金融、投資、取引、またはその他の種類の助言もしくは推奨であることを意図したものではなく、またこれらに該当するものでもありません。詳細は利用規約をご覧ください。
オープンソーススクリプト
TradingViewの精神に則り、このスクリプトの作者はコードをオープンソースとして公開してくれました。トレーダーが内容を確認・検証できるようにという配慮です。作者に拍手を送りましょう!無料で利用できますが、コードの再公開はハウスルールに従う必要があります。
免責事項
これらの情報および投稿は、TradingViewが提供または承認する金融、投資、取引、またはその他の種類の助言もしくは推奨であることを意図したものではなく、またこれらに該当するものでもありません。詳細は利用規約をご覧ください。