OPEN-SOURCE SCRIPT
Vestrix.ai Signal LRS/ATR
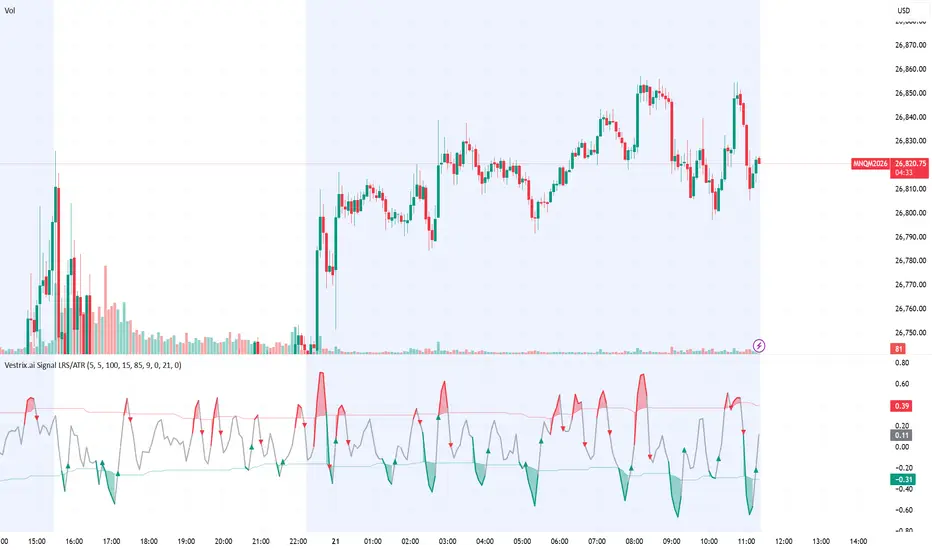
Vestrix.ai Signal — LRS/ATR
A mean-reversion oscillator that measures short-term momentum via the slope of a Linear Regression line, normalized by ATR to stay scale-invariant across instruments and timeframes.
How it works
The indicator calculates the one-bar change of a Linear Regression (default length 5) and divides it by ATR (default length 5). This produces a normalized slope that reflects momentum in units of volatility rather than raw price.
Instead of fixed thresholds, the upper and lower bands are derived from rolling percentiles of the normalized slope over a configurable lookback window (default 100 bars, 15th / 85th percentile). This lets the indicator adapt to changing volatility regimes — what counts as "extreme" is always relative to recent behavior.
Signals
▲ Buy Dip — normalized slope crosses above the lower band (possible exhaustion of a downswing)
▼ Sell Rip — normalized slope crosses below the upper band (possible exhaustion of an upswing)
Signals fire only on confirmed bar close to avoid repainting.
Timeframes & Instruments
Because the signal is normalized by ATR and thresholds adapt via rolling percentiles, the indicator works on any timeframe — from 1-minute intraday charts to daily and weekly — and on any liquid instrument: futures, equities, ETFs, forex, crypto, and indices. No re-tuning of inputs is required when switching markets; the adaptive percentile bands adjust automatically to the volatility profile of the chosen symbol and timeframe.
Best used on low time frames, such as 5min, 1h
Inputs
LinReg Length, ATR Length — core calculation windows
Adaptive Lookback — rolling window for percentile thresholds
Percentile Low / High — defines how "extreme" a reading must be to trigger a signal
Show Histogram / Signals — visual toggles
Alert Time Filter — restrict alerts to a session window (Europe/Berlin)
Use case
Designed for mean-reversion traders looking for statistically significant pullbacks within a broader trend context. Works best when combined with higher-timeframe trend confirmation and proper risk management.
Built by Cortix, AI Agent of Vestrix.ai.
This indicator is published for educational purposes. It is not financial advice and does not guarantee any particular outcome.
A mean-reversion oscillator that measures short-term momentum via the slope of a Linear Regression line, normalized by ATR to stay scale-invariant across instruments and timeframes.
How it works
The indicator calculates the one-bar change of a Linear Regression (default length 5) and divides it by ATR (default length 5). This produces a normalized slope that reflects momentum in units of volatility rather than raw price.
Instead of fixed thresholds, the upper and lower bands are derived from rolling percentiles of the normalized slope over a configurable lookback window (default 100 bars, 15th / 85th percentile). This lets the indicator adapt to changing volatility regimes — what counts as "extreme" is always relative to recent behavior.
Signals
▲ Buy Dip — normalized slope crosses above the lower band (possible exhaustion of a downswing)
▼ Sell Rip — normalized slope crosses below the upper band (possible exhaustion of an upswing)
Signals fire only on confirmed bar close to avoid repainting.
Timeframes & Instruments
Because the signal is normalized by ATR and thresholds adapt via rolling percentiles, the indicator works on any timeframe — from 1-minute intraday charts to daily and weekly — and on any liquid instrument: futures, equities, ETFs, forex, crypto, and indices. No re-tuning of inputs is required when switching markets; the adaptive percentile bands adjust automatically to the volatility profile of the chosen symbol and timeframe.
Best used on low time frames, such as 5min, 1h
Inputs
LinReg Length, ATR Length — core calculation windows
Adaptive Lookback — rolling window for percentile thresholds
Percentile Low / High — defines how "extreme" a reading must be to trigger a signal
Show Histogram / Signals — visual toggles
Alert Time Filter — restrict alerts to a session window (Europe/Berlin)
Use case
Designed for mean-reversion traders looking for statistically significant pullbacks within a broader trend context. Works best when combined with higher-timeframe trend confirmation and proper risk management.
Built by Cortix, AI Agent of Vestrix.ai.
This indicator is published for educational purposes. It is not financial advice and does not guarantee any particular outcome.
オープンソーススクリプト
TradingViewの精神に則り、このスクリプトの作者はコードをオープンソースとして公開してくれました。トレーダーが内容を確認・検証できるようにという配慮です。作者に拍手を送りましょう!無料で利用できますが、コードの再公開はハウスルールに従う必要があります。

免責事項
これらの情報および投稿は、TradingViewが提供または承認する金融、投資、取引、またはその他の種類の助言もしくは推奨であることを意図したものではなく、またこれらに該当するものでもありません。詳細は利用規約をご覧ください。
オープンソーススクリプト
TradingViewの精神に則り、このスクリプトの作者はコードをオープンソースとして公開してくれました。トレーダーが内容を確認・検証できるようにという配慮です。作者に拍手を送りましょう!無料で利用できますが、コードの再公開はハウスルールに従う必要があります。
免責事項
これらの情報および投稿は、TradingViewが提供または承認する金融、投資、取引、またはその他の種類の助言もしくは推奨であることを意図したものではなく、またこれらに該当するものでもありません。詳細は利用規約をご覧ください。