アップデート済
[blackcat] L2 Ehlers Hilbert Oscillator
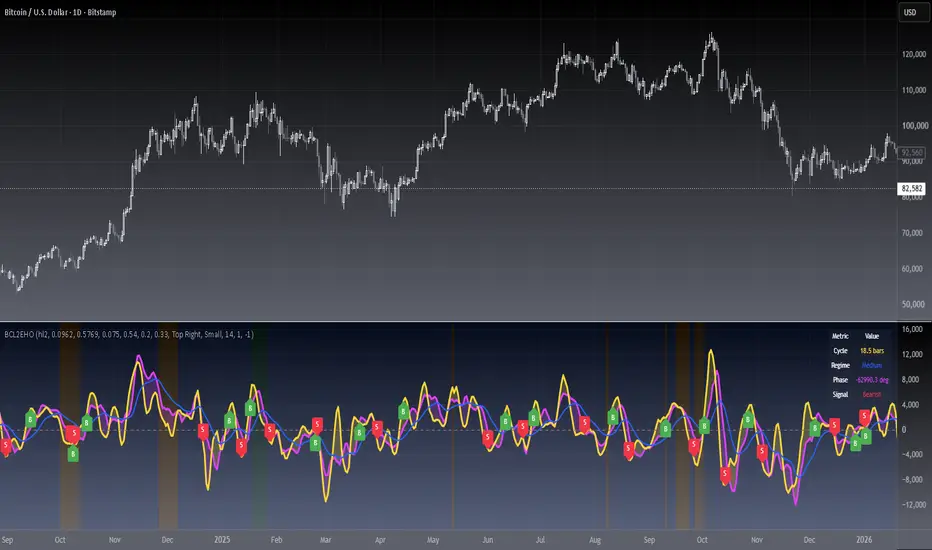
Level: 2
Background
John F. Ehlers introuced Hilbert Oscillator in his "Rocket Science for Traders" chapter 8. The Hilbert Oscillator identifies every major turning point.
Function
blackcat L2 Ehlers Hilbert Oscillator is used to follow the trend. Although it will not be a leading indicator because of the 2-bar lag required to compute Q3, it does prove itself to be superior to most currently available oscillators. The bandwidth for the computation of Value1 is twice the bandwidth of I3. Therefore, the amplitude compensation will be less, approximately the square root of 1.57, which is about 1.25. The Hilbert Oscillator identifies every major turning point.
Key Signal
Smooth --> 4 bar WMA w/ 1 bar lag
Detrender --> The amplitude response of a minimum-length HT can be improved by adjusting the filter coefficients by
trial and error. HT does not allow DC component at zero frequency for transformation. So, Detrender is used to remove DC component/ trend component.
Q1 --> Quadrature phase signal
I1 --> In-phase signal
Value1 ---> Hilbert Oscillator fast line
I3 ---> Hilbert Oscillator slow line
Pros and Cons
100% John F. Ehlers definition translation of original work, even variable names are the same. This help readers who would like to use pine to read his book. If you had read his works, then you will be quite familiar with my code style.
Remarks
The 7th script for Blackcat1402 John F. Ehlers Week publication.
Readme
In real life, I am a prolific inventor. I have successfully applied for more than 60 international and regional patents in the past 12 years. But in the past two years or so, I have tried to transfer my creativity to the development of trading strategies. Tradingview is the ideal platform for me. I am selecting and contributing some of the hundreds of scripts to publish in Tradingview community. Welcome everyone to interact with me to discuss these interesting pine scripts.
The scripts posted are categorized into 5 levels according to my efforts or manhours put into these works.
Level 1 : interesting script snippets or distinctive improvement from classic indicators or strategy. Level 1 scripts can usually appear in more complex indicators as a function module or element.
Level 2 : composite indicator/strategy. By selecting or combining several independent or dependent functions or sub indicators in proper way, the composite script exhibits a resonance phenomenon which can filter out noise or fake trading signal to enhance trading confidence level.
Level 3 : comprehensive indicator/strategy. They are simple trading systems based on my strategies. They are commonly containing several or all of entry signal, close signal, stop loss, take profit, re-entry, risk management, and position sizing techniques. Even some interesting fundamental and mass psychological aspects are incorporated.
Level 4 : script snippets or functions that do not disclose source code. Interesting element that can reveal market laws and work as raw material for indicators and strategies. If you find Level 1~2 scripts are helpful, Level 4 is a private version that took me far more efforts to develop.
Level 5 : indicator/strategy that do not disclose source code. private version of Level 3 script with my accumulated script processing skills or a large number of custom functions. I had a private function library built in past two years. Level 5 scripts use many of them to achieve private trading strategy.
Background
John F. Ehlers introuced Hilbert Oscillator in his "Rocket Science for Traders" chapter 8. The Hilbert Oscillator identifies every major turning point.
Function
blackcat L2 Ehlers Hilbert Oscillator is used to follow the trend. Although it will not be a leading indicator because of the 2-bar lag required to compute Q3, it does prove itself to be superior to most currently available oscillators. The bandwidth for the computation of Value1 is twice the bandwidth of I3. Therefore, the amplitude compensation will be less, approximately the square root of 1.57, which is about 1.25. The Hilbert Oscillator identifies every major turning point.
Key Signal
Smooth --> 4 bar WMA w/ 1 bar lag
Detrender --> The amplitude response of a minimum-length HT can be improved by adjusting the filter coefficients by
trial and error. HT does not allow DC component at zero frequency for transformation. So, Detrender is used to remove DC component/ trend component.
Q1 --> Quadrature phase signal
I1 --> In-phase signal
Value1 ---> Hilbert Oscillator fast line
I3 ---> Hilbert Oscillator slow line
Pros and Cons
100% John F. Ehlers definition translation of original work, even variable names are the same. This help readers who would like to use pine to read his book. If you had read his works, then you will be quite familiar with my code style.
Remarks
The 7th script for Blackcat1402 John F. Ehlers Week publication.
Readme
In real life, I am a prolific inventor. I have successfully applied for more than 60 international and regional patents in the past 12 years. But in the past two years or so, I have tried to transfer my creativity to the development of trading strategies. Tradingview is the ideal platform for me. I am selecting and contributing some of the hundreds of scripts to publish in Tradingview community. Welcome everyone to interact with me to discuss these interesting pine scripts.
The scripts posted are categorized into 5 levels according to my efforts or manhours put into these works.
Level 1 : interesting script snippets or distinctive improvement from classic indicators or strategy. Level 1 scripts can usually appear in more complex indicators as a function module or element.
Level 2 : composite indicator/strategy. By selecting or combining several independent or dependent functions or sub indicators in proper way, the composite script exhibits a resonance phenomenon which can filter out noise or fake trading signal to enhance trading confidence level.
Level 3 : comprehensive indicator/strategy. They are simple trading systems based on my strategies. They are commonly containing several or all of entry signal, close signal, stop loss, take profit, re-entry, risk management, and position sizing techniques. Even some interesting fundamental and mass psychological aspects are incorporated.
Level 4 : script snippets or functions that do not disclose source code. Interesting element that can reveal market laws and work as raw material for indicators and strategies. If you find Level 1~2 scripts are helpful, Level 4 is a private version that took me far more efforts to develop.
Level 5 : indicator/strategy that do not disclose source code. private version of Level 3 script with my accumulated script processing skills or a large number of custom functions. I had a private function library built in past two years. Level 5 scripts use many of them to achieve private trading strategy.
リリースノート
OVERVIEWThe [blackcat] L2 Ehlers Hilbert Oscillator is a technical analysis tool designed to identify trends and potential reversal points in financial markets. It uses advanced mathematical techniques to filter out noise and highlight significant price movements.
FEATURES
Source Input: Allows users to select the price source (default is HL2).
Hilbert Transform: Applies a complex mathematical transformation to the price data to extract the in-phase (I) and quadrature (Q) components.
Plotting: Displays the I and IQ components on the chart, with a fill area between them based on their relative values.
Period Calculation: Automatically adjusts the period based on the calculated Hilbert Oscillator values to ensure accurate trend identification.
HOW TO USE
Add the script to your TradingView chart.
Adjust the "Source" input to your desired price series.
Observe the I and IQ plots and the fill area to identify potential trend reversals and strong price movements.
LIMITATIONS
The script may not perform optimally on extremely volatile or low-volume markets.
The default settings are optimized for general use but may need adjustment for specific trading strategies.
NOTES
This script is based on the work of Ehlers and has been adapted for use in TradingView.
Ensure you understand the underlying mathematics to make informed trading decisions.
リリースノート
█ OVERVIEWEhlers Hilbert Oscillator extracts the dominant cycle from price data using John Ehlers' Hilbert Transform and Homodyne Discriminator. It maps cycle phase, period length, and regime in real time, helping traders distinguish oscillating from trending market conditions.
█ CONCEPTS
This indicator applies 4-bar weighted smoothing to price, then decomposes the detrended signal into InPhase and Quadrature phasor components through a Hilbert FIR filter. A homodyne discriminator recovers the instantaneous cycle period (6 to 50 bars), feeding back into the filter normalization for adaptive tracking.
Key principles:
• Cycle Decomposition: price splits into InPhase (I) and Quadrature (Q) components 90 degrees out of phase
• Period Estimation: homodyne mixing extracts the dominant cycle length from the smoothed phasor
• Phase Integration: the I3 output integrates the Quadrature component over a full cycle, yielding a rotating phase angle
█ HOW TO USE
1 — Add the script to a chart in a separate pane; values appear after a 32-bar warm-up
2 — Adjust the Filter Coefficients group to fine-tune sensitivity for different instruments
3 — Read the status table for cycle length, regime, phase angle, and signal direction
Input Parameters
• Source: price series fed to the transform (default hl2)
• Show Signal Line: toggles an EMA signal line over the I component
• Overbought / Oversold Levels: configurable thresholds for cycle extremes
• Highlight Zero Crossings: marks I-component crossings of the zero line
• Cycle Regime Background: color-coded pane tint (teal = short, blue = medium, orange = long)
• Filter Coefficients: FIR coefficients, normalization factors, and EMA alpha values
• Status Table: toggle and position/size controls for the info panel
█ FEATURES
• Real-time dominant cycle period estimation (6 to 50 bars, EMA-smoothed)
• Phase-integral output (I3) and half-cycle component (Value1) with dual-axis visualization
• Cycle regime classification with background coloring
• Interactive status table showing cycle length, regime, phase angle, and signal direction
• Zero-line crossing markers and overbought/oversold zone detection
• Configurable alert conditions for zero crossings and extreme zones
• All filter coefficients exposed as inputs for customization
█ SIGNALS
Visual Elements
• Fuchsia line (I): phase-integral component representing current cycle phase
• Yellow line (IQ): half-cycle component, responds faster than I
• Fill between I and IQ: yellow when I leads, fuchsia when IQ leads
• Blue line (Signal): EMA of the I component; I above Signal suggests bullish phase
• Green/Red triangles: zero-line crossings of the I component
• Background tint: teal for short cycles, blue for medium, orange for long cycles
• Status table: cycle length, regime label, phase angle, and I vs Signal comparison
█ IMPLEMENTATION NOTES
Built on John Ehlers' framework from Rocket Science for Traders. The Hilbert FIR uses configurable 0.0962 / 0.5769 coefficients. The period is estimated by homodyne mixing and refined with exponential averaging, following the TA-Lib HT_DCPERIOD convention. All series are computed once per bar with no higher-timeframe requests, so the study does not repaint after bar close. Values appear after a 32-bar warm-up. The quadrant-corrected arctangent ensures accurate period estimation.
█ LIMITATIONS
• The Hilbert FIR approximation is only meaningful for cycles between 6 and 50 bars
• Requires 32 bars of history before any values are produced
• Cycle-analysis tools degrade in strongly trending or illiquid markets
• Enabling the period plot mixes scales — move the indicator to its own pane
█ NOTES
• Based on John F. Ehlers, Rocket Science for Traders (Wiley, 2001)
• This is a cycle-research tool, not a trading system
• Open source under Mozilla Public License 2.0
═════════════════════════════════════════════════════════════════════════
For questions or feedback, use comments section below.
Feel free to use and modify — attribution appreciated.

Don't miss out! The first and most important thing to do is to join my Discord chat now! Click here to start your adventure: discord.com/invite/ZTGpQJq My new github for more pine development soon: github.com/wxt-coder
免責事項
これらの情報および投稿は、TradingViewが提供または承認する金融、投資、取引、またはその他の種類の助言もしくは推奨であることを意図したものではなく、またこれらに該当するものでもありません。詳細は利用規約をご覧ください。
Don't miss out! The first and most important thing to do is to join my Discord chat now! Click here to start your adventure: discord.com/invite/ZTGpQJq My new github for more pine development soon: github.com/wxt-coder
免責事項
これらの情報および投稿は、TradingViewが提供または承認する金融、投資、取引、またはその他の種類の助言もしくは推奨であることを意図したものではなく、またこれらに該当するものでもありません。詳細は利用規約をご覧ください。