Laguerre Filter_HCM
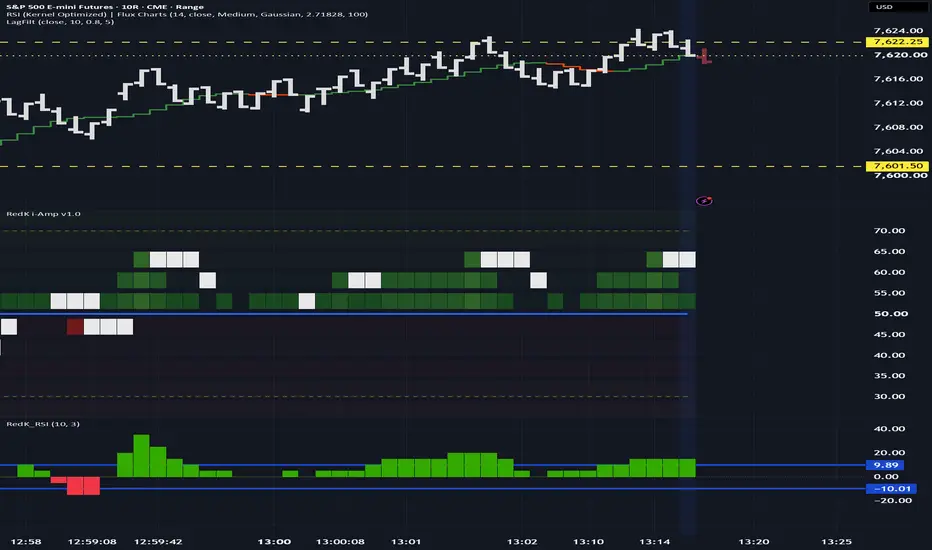
Adapted Laguerre Filter _ Ehler
How to interpret it on a trading chart
Read it primarily as a trend baseline:
Price above a rising filter suggests bullish alignment.
Price below a falling filter suggests bearish alignment.
A flattening filter with repeated price crossings signals a less useful environment for trend-following entries.
A slope change tells you the smoothed price direction has turned—not that a durable reversal is guaranteed.
The attraction is a relatively clean line that can remain responsive. The limitation is the same fundamental trade-off you face with other smoothers: removing more noise also delays recognition of genuine changes. Claims that it is universally “better than an EMA” need a specific comparison of settings and smoothness, not just a visual impression.
How to interpret it on a trading chart
Read it primarily as a trend baseline:
Price above a rising filter suggests bullish alignment.
Price below a falling filter suggests bearish alignment.
A flattening filter with repeated price crossings signals a less useful environment for trend-following entries.
A slope change tells you the smoothed price direction has turned—not that a durable reversal is guaranteed.
The attraction is a relatively clean line that can remain responsive. The limitation is the same fundamental trade-off you face with other smoothers: removing more noise also delays recognition of genuine changes. Claims that it is universally “better than an EMA” need a specific comparison of settings and smoothness, not just a visual impression.

免責事項
これらの情報および投稿は、TradingViewが提供または承認する金融、投資、取引、またはその他の種類の助言もしくは推奨であることを意図したものではなく、またこれらに該当するものでもありません。詳細は利用規約をご覧ください。
免責事項
これらの情報および投稿は、TradingViewが提供または承認する金融、投資、取引、またはその他の種類の助言もしくは推奨であることを意図したものではなく、またこれらに該当するものでもありません。詳細は利用規約をご覧ください。