OPEN-SOURCE SCRIPT
c-c/MA (Simplified 2-Color)
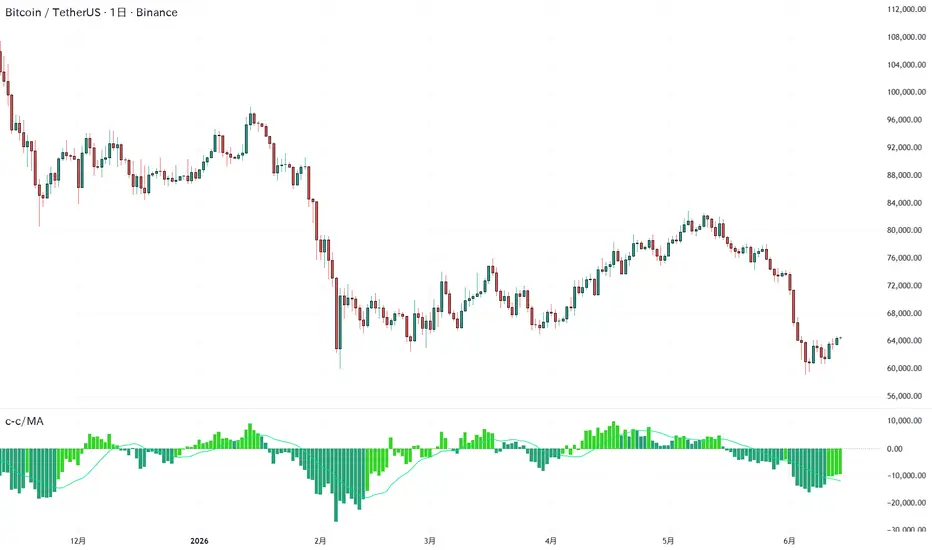
c-c/MA (Simplified 2-Color)
This indicator is a simple momentum analysis tool that visualizes price movement by comparing the current price with the price from a specified number of periods ago.
It displays the price difference as a histogram and applies a Simple Moving Average (SMA) to help identify trend strength and momentum shifts.
Features
Price Difference (c-c)
The indicator calculates the difference between the current closing price and the closing price from a specified number of bars ago:
* Positive values indicate that the current price is higher than the past price.
* Negative values indicate that the current price is lower than the past price.
SMA Smoothing
A Simple Moving Average (SMA) is applied to the histogram to smooth short-term fluctuations and highlight the overall momentum trend.
Two-Color Histogram
The histogram changes color based on its relationship to the SMA:
* Above SMA: Indicates relatively stronger momentum.
* Below SMA: Indicates weaker or slowing momentum.
Zero Line
The zero line represents the point where the current price equals the price from the selected lookback period:
* Above zero: Bullish momentum.
* Below zero: Bearish momentum.
How to Use
This indicator can be used to:
* Identify trend direction
* Evaluate momentum strength
* Detect potential trend shifts
* Complement other indicators such as RSI, volume analysis, or moving averages
Note: This indicator is designed as a supporting analytical tool and should be used alongside other forms of market analysis and risk management.
This indicator is a simple momentum analysis tool that visualizes price movement by comparing the current price with the price from a specified number of periods ago.
It displays the price difference as a histogram and applies a Simple Moving Average (SMA) to help identify trend strength and momentum shifts.
Features
Price Difference (c-c)
The indicator calculates the difference between the current closing price and the closing price from a specified number of bars ago:
* Positive values indicate that the current price is higher than the past price.
* Negative values indicate that the current price is lower than the past price.
SMA Smoothing
A Simple Moving Average (SMA) is applied to the histogram to smooth short-term fluctuations and highlight the overall momentum trend.
Two-Color Histogram
The histogram changes color based on its relationship to the SMA:
* Above SMA: Indicates relatively stronger momentum.
* Below SMA: Indicates weaker or slowing momentum.
Zero Line
The zero line represents the point where the current price equals the price from the selected lookback period:
* Above zero: Bullish momentum.
* Below zero: Bearish momentum.
How to Use
This indicator can be used to:
* Identify trend direction
* Evaluate momentum strength
* Detect potential trend shifts
* Complement other indicators such as RSI, volume analysis, or moving averages
Note: This indicator is designed as a supporting analytical tool and should be used alongside other forms of market analysis and risk management.
オープンソーススクリプト
TradingViewの精神に則り、このスクリプトの作者はコードをオープンソースとして公開してくれました。トレーダーが内容を確認・検証できるようにという配慮です。作者に拍手を送りましょう!無料で利用できますが、コードの再公開はハウスルールに従う必要があります。

免責事項
これらの情報および投稿は、TradingViewが提供または承認する金融、投資、取引、またはその他の種類の助言もしくは推奨であることを意図したものではなく、またこれらに該当するものでもありません。詳細は利用規約をご覧ください。
オープンソーススクリプト
TradingViewの精神に則り、このスクリプトの作者はコードをオープンソースとして公開してくれました。トレーダーが内容を確認・検証できるようにという配慮です。作者に拍手を送りましょう!無料で利用できますが、コードの再公開はハウスルールに従う必要があります。
免責事項
これらの情報および投稿は、TradingViewが提供または承認する金融、投資、取引、またはその他の種類の助言もしくは推奨であることを意図したものではなく、またこれらに該当するものでもありません。詳細は利用規約をご覧ください。