OPEN-SOURCE SCRIPT
The Mean Goose v1
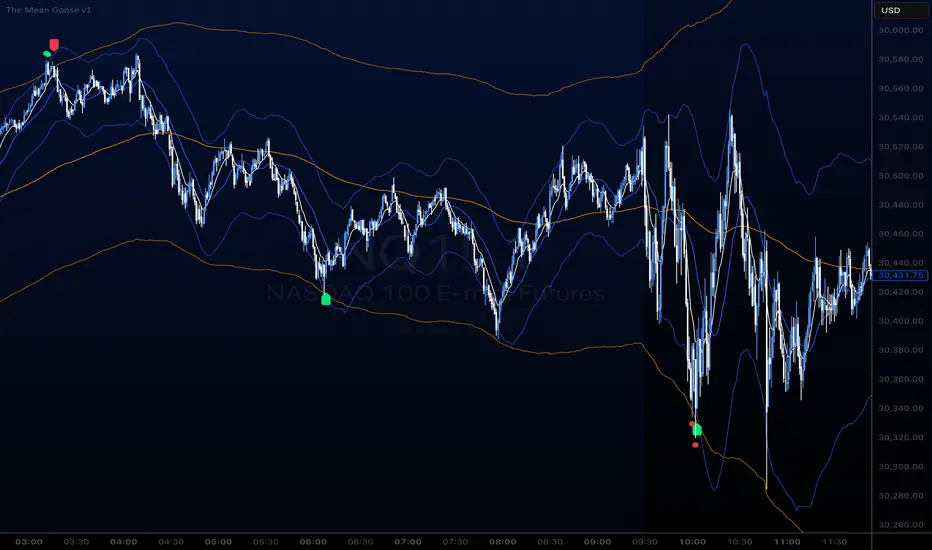
The Mean Goose
CONCEPT
The Mean Goose is a mean-reversion tool built to identify exhaustion extremes and
signal their reversal. The premise is that price stretching well beyond its typical
range often precedes a snap back toward the mean — but acting on an extreme alone is
unreliable, because price can keep extending in an orderly way. The Mean Goose
addresses this with two Keltner Channels that do different jobs, plus an EMA that
times the reversal.
WHY TWO CHANNELS
The two channels are not redundant — each filters a different problem:
- The wide channel (slow, long-period) marks major extremes. It defines the zone
where price has stretched far enough from the mean to be a mean-reversion candidate
at all.
- The tight channel (fast, short-period) identifies exhaustion. Its job is to filter
out price that is simply grinding higher or lower in an efficient, orderly manner —
the kind of trending move that pokes a single band repeatedly without ever being
truly overextended. By requiring the candle's extreme to clear BOTH channels at once,
the script ignores efficient drift and isolates moves that are stretched on two
timeframes simultaneously. This dual condition is the core filter and is what
separates a genuine exhaustion event from ordinary directional price action.
THE EMA AS REVERSAL SIGNAL
Clearing both channels arms the setup but does not trigger it. The script then waits
for confirmation that reversion has actually begun, defined as a candle closing back
through a fast EMA in the opposite direction of the extreme. The EMA recross is the
timing component — it keeps the script from firing into a move that is still extending
and only signals once price has started to revert.
HOW THE SIGNAL LOGIC WORKS
The script runs two independent state machines:
High setup (looks for a reversal down)
1. A breakout dot prints above a candle whose high clears BOTH upper channels.
2. This arms an internal high trigger.
3. While armed, the first candle that closes below the EMA prints a down arrow above
the bar — the reversal signal.
4. The trigger resets and waits for the next exhaustion extreme.
Low setup (looks for a reversal up)
1. A breakout dot prints below a candle whose low clears BOTH lower channels.
2. This arms an internal low trigger.
3. While armed, the first candle that closes above the EMA prints an up arrow below
the bar — the reversal signal.
4. The trigger resets and waits for the next exhaustion extreme.
The two setups run independently, so a long and short context can be armed at the
same time.
WHAT IT PLOTS
- Wide Keltner Channel — defaults: Length 200, Multiplier 9.5, EMA basis, ATR Length 200.
- Tight Keltner Channel — defaults: Length 20, Multiplier 3.5, SMA basis, ATR Length 40.
- EMA — the reversal reference line. Default Length 9.
- Breakout dots — mark candles whose extreme clears both channels (above for highs,
below for lows).
- Reversal arrows — down arrow after a high exhaustion once price closes back below the
EMA; up arrow after a low exhaustion once price closes back above the EMA.
OPTIONAL HIGH-OF-DAY / LOW-OF-DAY FILTER
A "Require new HOD/LOD" toggle (off by default) further restricts breakout dots to
candles that also set a new session high or low, for traders who only want to act on
exhaustion that coincides with a fresh daily extreme. The session resets each day at a
user-defined time (default 18:00 America/New_York). Use the Reset Hour, Reset Minute
and Timezone inputs to match your market's session.
INPUTS
- Wide / Tight Keltner Channels: Length, Multiplier, Source, Use Exponential MA, ATR Length.
- EMA: Length, Source, Offset.
- Breakout Dots: Require new HOD/LOD, Reset Hour, Reset Minute, Timezone.
DEVELOPMENT NOTES
The default settings were developed on NQ (Nasdaq 100 futures) on the 1-minute chart.
Other instruments and timeframes will likely need the channel lengths, multipliers and
EMA period re-tuned to behave sensibly.
NOTES AND LIMITATIONS
- On intraday charts the session reset only lands cleanly when the reset time aligns
with a candle boundary.
- If an exhaustion candle also closes back through the EMA on the same bar, the arrow
can fire on that bar.
- This is an analysis and visualisation tool. It does not place orders and makes no
guarantee of future results. Always test on your own instrument and timeframe before
relying on it.
オープンソーススクリプト
TradingViewの精神に則り、このスクリプトの作者はコードをオープンソースとして公開してくれました。トレーダーが内容を確認・検証できるようにという配慮です。作者に拍手を送りましょう!無料で利用できますが、コードの再公開はハウスルールに従う必要があります。

免責事項
これらの情報および投稿は、TradingViewが提供または承認する金融、投資、取引、またはその他の種類の助言もしくは推奨であることを意図したものではなく、またこれらに該当するものでもありません。詳細は利用規約をご覧ください。
オープンソーススクリプト
TradingViewの精神に則り、このスクリプトの作者はコードをオープンソースとして公開してくれました。トレーダーが内容を確認・検証できるようにという配慮です。作者に拍手を送りましょう!無料で利用できますが、コードの再公開はハウスルールに従う必要があります。
免責事項
これらの情報および投稿は、TradingViewが提供または承認する金融、投資、取引、またはその他の種類の助言もしくは推奨であることを意図したものではなく、またこれらに該当するものでもありません。詳細は利用規約をご覧ください。