OPEN-SOURCE SCRIPT
更新済 Relative Volume Strength Index
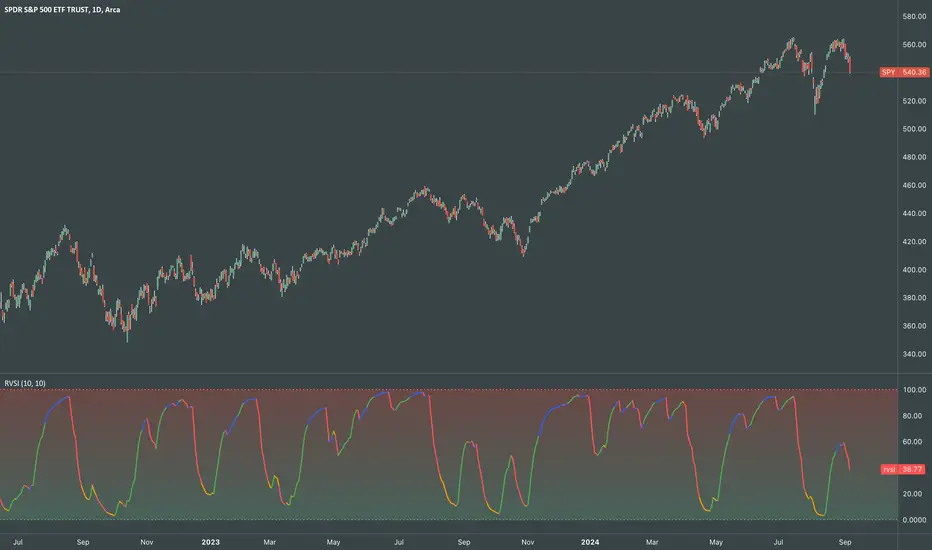
RVSI is an alternative volume-based indicator that measures the rate of change of average OBV.
How to read a chart using it?
It looks simple, but it's powerful!
I'd use RVSI in combination with price-based indicators.
How to read a chart using it?
- First signal to buy is when you see RVSI is close to green oversold levels.
- Once RVSI passes above it's orange EMA, that would be the second alert of accumulation.
- Be always cautious when it reaches 50 level as a random statistical correction can be expected because of "market noises".
- You know it's a serious uptrend when it reaches above 75 and fluctuates there, grading behind EMA.
- The best signal to sell would be a situation where you see RVSI passing below it's EMA when the whole thing is close to Red overbought level
It looks simple, but it's powerful!
I'd use RVSI in combination with price-based indicators.
リリースノート
Update:Added visual intuitiveness
リリースノート
updリリースノート
Effective increase in responsiveness due to a slight change in formula.リリースノート
- Color-coded rate of change relative to its linear regression
- Changed formula to enhance the responsiveness
オープンソーススクリプト
TradingViewの精神に則り、このスクリプトの作者はコードをオープンソースとして公開してくれました。トレーダーが内容を確認・検証できるようにという配慮です。作者に拍手を送りましょう!無料で利用できますが、コードの再公開はハウスルールに従う必要があります。

免責事項
これらの情報および投稿は、TradingViewが提供または承認する金融、投資、取引、またはその他の種類の助言もしくは推奨であることを意図したものではなく、またこれらに該当するものでもありません。詳細は利用規約をご覧ください。
オープンソーススクリプト
TradingViewの精神に則り、このスクリプトの作者はコードをオープンソースとして公開してくれました。トレーダーが内容を確認・検証できるようにという配慮です。作者に拍手を送りましょう!無料で利用できますが、コードの再公開はハウスルールに従う必要があります。
免責事項
これらの情報および投稿は、TradingViewが提供または承認する金融、投資、取引、またはその他の種類の助言もしくは推奨であることを意図したものではなく、またこれらに該当するものでもありません。詳細は利用規約をご覧ください。