OPEN-SOURCE SCRIPT
Statistical VWAP study: Session and RTH VWAP
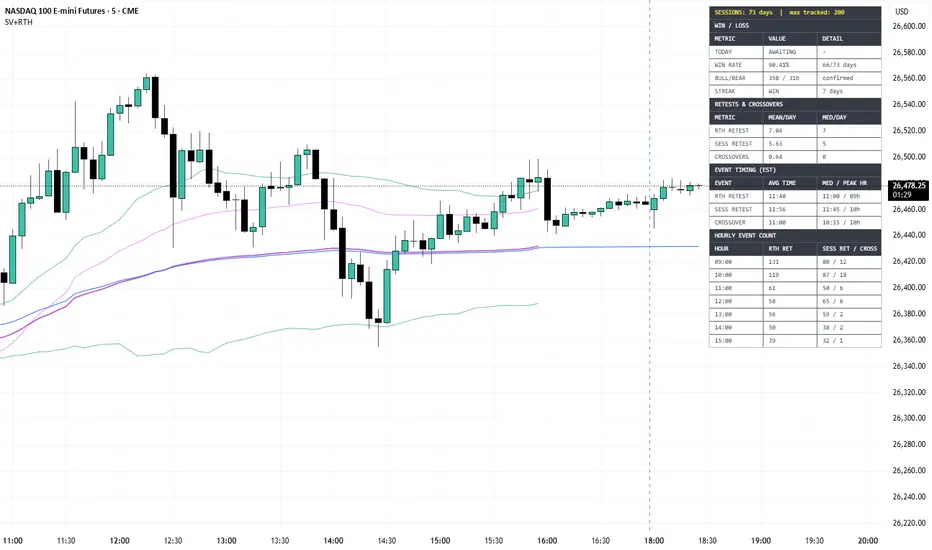
Session & RTH VWAP — Statistical VWAP Study
This indicator plots two independently calculated Volume Weighted Average Price lines — one anchored to a user-defined pre-market or custom session, and one anchored to the Regular Trading Hours (RTH) open — and combines them into a statistical study that tracks the relationship between the two lines over time. Beyond the two VWAP lines themselves, the indicator calculates a set of statistical deviation bands derived from the midpoint between both VWAPs, maintains a live stats table that tracks retest and crossover behaviour with timing data, and records win/loss statistics based on the directional relationship between the two lines at the close of each RTH session.
The indicator is designed for equity futures traders and anyone who trades instruments with a defined RTH session, though it will function on any market where session times can be configured. It is most useful on intraday timeframes, particularly 1-minute through 15-minute charts, where the two VWAP lines are meaningfully separated and the statistical bands have enough bar data to fill in during the session.
─────────────────────────────────────────────
HOW THE TWO VWAPs WORK
─────────────────────────────────────────────
The Session VWAP anchors to the start of a configurable pre-market or custom session each day and recalculates bar by bar from that anchor using the standard cumulative price-times-volume divided by cumulative volume formula. Because it anchors before the RTH open on most configurations, it captures the overnight sentiment and carry-forward context that the RTH VWAP does not see. The line resets each day at the session start and, uniquely, reanchors dynamically if price makes a new session high — meaning the anchor always sits at the highest point reached during the session rather than being fixed at the first bar. This makes the Session VWAP a high-anchored VWAP that tracks where the average transaction has occurred relative to the session's developing high.
The RTH VWAP anchors to the first bar of the Regular Trading Hours session each day — defaulting to 09:30 EST — and calculates forward from that point. It is a straightforward daily VWAP in the conventional sense, widely used by institutional participants as an execution benchmark. It resets at the RTH open every day regardless of overnight price action.
Both VWAPs have independent price source inputs, so you can, for example, run the Session VWAP on HLC3 and the RTH VWAP on the close, or set both to the same source. Both default to HLC3. Previous session VWAP lines can be displayed on chart for historical context, with the number of retained sessions configurable up to 100.
─────────────────────────────────────────────
THE ANCHOR AND DEVIATION BANDS
─────────────────────────────────────────────
Once both VWAPs are active during the RTH session, the indicator calculates a midpoint anchor on each bar as the simple average of the two VWAP values at that moment. This anchor represents an equilibrium level between the two measures — a price around which both institutional benchmarks are balanced. The anchor can be plotted as a standalone line if desired.
All statistical bands are then derived as offsets from this anchor, calculated from the distribution of bar-by-bar deviations of the price source from the anchor during the current RTH session. Each bar inside the RTH session contributes a deviation value (price minus anchor) and an absolute deviation value to a running intraday dataset that the band calculations draw from. Every band type resets at the RTH open and builds from scratch each session, meaning the bands are always describing the current day's price behaviour relative to the anchor rather than any historical average.
Symmetric Standard Deviation Bands (± 1σ and ± 2σ)
These are calculated using the volume-weighted variance of all bar deviations from the anchor during the session. The formula weights each bar's squared deviation by its volume, so high-volume bars contribute proportionally more to the width of the bands than low-volume bars. The result is a proper volume-weighted standard deviation, not a simple statistical standard deviation. The ± 1σ bands mark the range within which approximately 68% of volume-weighted price activity has occurred relative to the anchor, and ± 2σ marks roughly 95%. On a well-behaved session these bands will tend to expand gradually and consistently as the day progresses. A sudden widening indicates a volatile push away from the anchor with significant volume behind it.
Asymmetric Standard Deviation Bands
Rather than computing a single standard deviation across all deviations, the asymmetric bands split the deviation dataset into two groups: bars where price was above the anchor and bars where price was below the anchor. A separate volume-weighted variance is computed for each group, yielding an upper sigma and a lower sigma. The upper band sits at anchor plus the upper sigma, and the lower band sits at anchor minus the lower sigma. When the upper band is wider than the lower band, the session's upside volatility has been greater than its downside volatility — the distribution is stretched to the upside. The reverse indicates downside skew. This is a more honest representation of intraday volatility than symmetric bands when the session has a directional bias, since symmetric bands will always produce identical upper and lower widths regardless of where price has actually been spending its time.
Median Absolute Deviation Bands (MAD)
The MAD bands are calculated from the median of all absolute deviation values collected during the session. Rather than squaring deviations as standard deviation does, MAD takes the median of their absolute values, making it substantially more resistant to outlier bars. A single spike bar with a large deviation will pull the standard deviation bands outward significantly, but will have very little impact on the MAD bands if the majority of bars have remained close to the anchor. In practice, if the MAD bands are noticeably narrower than the ± 1σ bands, it suggests the session has had one or more sharp but brief excursions from the anchor while most activity has been tightly contained. If the two are similar in width, price volatility has been more evenly distributed throughout the session.
Percentile Bands (10th, 25th, 75th, 90th)
These bands are calculated by sorting the full array of per-bar deviations accumulated during the session and finding the deviation at each percentile using linear interpolation between adjacent values. The result is added to the anchor to produce the plotted level. The 25th and 75th percentile bands define the interquartile range — the zone within which the middle 50% of bars have traded relative to the anchor. The 10th and 90th percentile bands mark the outer boundaries that only 10% of bars have exceeded on each side. Unlike standard deviation bands, percentile bands make no assumption about the shape of the deviation distribution. They are purely empirical — they describe exactly where price has been during the session without any statistical model underlying them. On a trending session the percentile bands will be visibly asymmetric, sitting closer together on one side of the anchor and more spread on the other, directly reflecting the directional distribution of bars.
VWAP of Deviations
This is a single line calculated as the volume-weighted mean of all bar deviations from the anchor during the session. It is plotted as an offset from the anchor — if the line is above the anchor, it means that volume has been transacting above the anchor on a net basis throughout the day. If it is below, the heavier volume has been printing below the anchor. At the very start of the RTH session when both VWAPs are close to each other the line will be near the anchor, and it will drift in the direction where the heavier volume has been occurring as the session progresses. It functions as a volume-weighted bias indicator — a reading consistently above the anchor suggests buyers have been more active on a volume basis, and vice versa.
─────────────────────────────────────────────
CONFIGURATION — SESSIONS SETTINGS
─────────────────────────────────────────────
Time Zone sets the timezone used to interpret the Session window. The tooltip reminds you that GMT and UTC are equivalent. Match this to the timezone shown in the bottom right of your TradingView chart. The default is GMT-4, which corresponds to US Eastern Daylight Time.
Session defines the start and end time of the window within which the Session VWAP is active and accumulating. The default is 0600-0900, representing the pre-market period from 6am to 9am Eastern. You can change this to any time window that suits your instrument and trading style. On instruments without an extended pre-market you might set this to your own session open or any other meaningful anchor time.
Highlight Session enables a background colour fill on bars that fall within the session window, making it easy to see which bars are contributing to the Session VWAP. The colour is configurable next to the toggle and defaults to a faint aqua.
─────────────────────────────────────────────
CONFIGURATION — ANCHOR SESSION VWAP SETTINGS
─────────────────────────────────────────────
VWAP Source sets the price input used for the Session VWAP calculation. The default is HLC3 (the average of high, low, and close), which is the conventional choice for VWAP calculations. Other available options include close, open, HL2, OHLC4, and HLCC4. Changing this will affect both the VWAP line itself and the deviation values used in the band calculations, since the bands use vsrc as their price input.
Session VWAP enables or disables the Session VWAP line on the chart. The colour and line width are set using the colour picker and width field next to the toggle.
Show Previous Session VWAPs enables the display of completed Session VWAP lines from prior days, drawn in the same colour as the live line. These give you a visual history of where previous sessions' VWAPs settled and how the current session compares.
Number of Previous Sessions controls how many prior session VWAP lines are retained on the chart. The range is 1 to 100, defaulting to 50. Higher values provide more historical context but may create visual clutter on longer lookback charts.
─────────────────────────────────────────────
CONFIGURATION — RTH VWAP SETTINGS
─────────────────────────────────────────────
Show RTH VWAP enables or disables the RTH VWAP line. The colour and width are set using the adjacent controls. The RTH VWAP defaults to purple at width 2, making it visually distinct from the thinner Session VWAP.
RTH Session Time (EST) sets the start and end of the RTH window using a session string in the format HHMM-HHMM, interpreted in the America/New_York timezone. The default is 0930-1600, representing the standard US equity market session. Change this for futures instruments that have different session boundaries, or for non-US markets where you want to define a custom RTH equivalent.
RTH VWAP Source sets the price input used specifically for the RTH VWAP calculation, independently of the Session VWAP source. It defaults to HLC3. Having separate source inputs means you can experiment with different price inputs on each line — for example running the RTH VWAP on the close while keeping the Session VWAP on HLC3 — or simply keep both on the same source for consistency.
─────────────────────────────────────────────
CONFIGURATION — STATS TABLE
─────────────────────────────────────────────
Show Stats Table enables or disables the on-chart statistics table.
Position sets where the table appears on the chart. Options cover all eight corners and edge-centre positions. The default is Top Right.
Text Size controls the font size used throughout the table. Options are Tiny, Small, and Normal. Small is the default and suits most screen configurations.
Max Days to Track sets the maximum number of completed RTH sessions the indicator retains in its historical arrays for statistical calculations. The range is 10 to 500, defaulting to 100. Increasing this provides more statistically stable averages but increases memory usage. All statistics in the table — win rate, retest averages, timing distributions, hourly breakdowns — are computed across however many sessions have been recorded up to this limit.
─────────────────────────────────────────────
CONFIGURATION — BAND LEVELS
─────────────────────────────────────────────
Each band type has a checkbox to enable it and one or more colour pickers to control how it appears. All bands are off by default. Each is described in detail in the statistical bands section above. The controls are:
Anchor (midpoint) — enables the midpoint line between the two VWAPs, with a single colour picker. Useful as a reference when evaluating the bands.
± 1σ (symmetric) — enables the symmetric ± 1 standard deviation bands, with a single shared colour applied to both the upper and lower line.
± 2σ (symmetric) — enables the symmetric ± 2 standard deviation bands, with a single shared colour.
Asymmetric σ (upper/lower) — enables the asymmetric bands with separate colour pickers for the upper and lower line, allowing you to visually distinguish upside from downside volatility.
MAD (± median abs dev) — enables the MAD bands with a single shared colour.
Percentile bands (10/25/75/90) — enables all four percentile bands with separate colour pickers for the inner pair (25th/75th) and the outer pair (10th/90th).
VWAP of deviations — enables the volume-weighted mean deviation line with a single colour picker.
─────────────────────────────────────────────
THE STATS TABLE — WHAT IT SHOWS AND HOW TO READ IT
─────────────────────────────────────────────
The table is divided into four sections. A yellow header row at the very top shows the total number of completed RTH sessions recorded and the maximum days setting, so you always know the sample size behind the statistics.
Sessions Coverage
The coverage row reads as "SESSIONS: X days | max tracked: Y". X is the number of completed RTH sessions the indicator has observed and recorded since being applied to the chart. Y is the Max Days to Track setting. Once X equals Y the oldest sessions begin dropping off as new ones are added, keeping a rolling window. On a 1-minute chart with 100 max days, the indicator will typically reach the maximum within the first few weeks of chart data.
Win / Loss
This section tracks whether the relative position of the two VWAPs at the end of the RTH session correctly predicted the directional close for that day.
The TODAY row shows the current live state: whether the RTH VWAP is currently above or below the Session VWAP (RTH ABOVE or RTH BELOW), and whether price is currently above or below the RTH open (BULL or BEAR). If the RTH session has not yet started, it shows AWAITING.
WIN RATE shows the percentage of completed sessions in which the end-of-day RTH VWAP position correctly predicted the directional close. A session is counted as a win when the RTH VWAP finished above the Session VWAP and price closed above the RTH open (a bullish alignment), or when the RTH VWAP finished below the Session VWAP and price closed below the RTH open (a bearish alignment). The detail column shows the raw count as wins over total sessions.
BULL/BEAR shows the breakdown of winning sessions by direction — how many of the wins were in the bullish alignment versus the bearish alignment. This helps identify whether the signal has directional asymmetry on your instrument.
STREAK shows whether the current streak is a run of wins or losses and how many consecutive sessions it has lasted.
Retests & Crossovers
This section measures two types of intraday behaviour: VWAP retests and VWAP crossovers.
A retest is recorded when a bar's wick crosses through one of the VWAPs but the bar's close remains on the same side it was on before the wick. In other words, price touches or briefly pierces the VWAP level but the candle does not close through it, indicating the level held. RTH RETEST counts retests of the RTH VWAP and SESS RETEST counts retests of the Session VWAP. The mean and median columns show the average and median number of these events per day across the recorded session history. A mean of 3.2 for RTH retests, for example, means the RTH VWAP is typically touched and rejected roughly three times per session.
A crossover is recorded when the RTH VWAP crosses above or below the Session VWAP on a confirmed bar. This is a stronger event than a retest because it means the two benchmarks have swapped relative positions. CROSSOVERS shows the average and median number of such crosses per day. On low-volatility days in a clearly directional instrument the crossover count may be zero or one. On ranging or volatile days it may be several.
Event Timing
This section answers the question of when during the RTH session these events tend to happen. For each of the three event types — RTH retest, Session retest, and crossover — it shows the average time, the median time, and the peak hour, all in EST.
The average time is the mean of the fractional hour at which each event has occurred across the full history, converted to a HH:MM display. The median time is the 50th percentile of that same distribution. The peak hour is whichever one-hour bucket between 09:00 and 15:00 has accumulated the most events in total across the session history.
If the median RTH retest time is 10:08 and the peak hour is 10h, that tells you retests of the RTH VWAP have historically been most concentrated in the first hour after the open. If the average and median are separated — say average is 11:30 but median is 10:45 — it suggests there is a tail of late-session events pulling the mean later, but most activity happens earlier.
Hourly Event Count
This section gives you the raw breakdown of event counts by hour, running from the 09:00 hour through to the 15:00 hour. Each row represents one hour and shows the total number of RTH retests, Session retests, and crossovers that have occurred during that hour across all recorded sessions. This is the full distribution from which the peak hour in the timing section is derived, and it lets you see the shape of that distribution rather than just the peak. An instrument where the hourly counts are spread fairly evenly across all hours behaves very differently to one where most events are concentrated in the 09:00 and 15:00 hours, and that pattern is immediately visible here.
─────────────────────────────────────────────
TIPS FOR EFFECTIVE USE
─────────────────────────────────────────────
Start with the two VWAP lines alone and observe how often the RTH VWAP and Session VWAP converge, diverge, and cross during your instrument's typical session. The relative position of the two lines at the open versus at midday and close is the core input to the win/loss tracking, so developing an intuition for how they interact on your specific instrument before enabling the bands is worthwhile.
The win rate statistic is a measure of historical alignment between the two VWAPs and the daily directional close — it is not a prediction of tomorrow's outcome. Its value is in telling you whether the two-VWAP relationship has had directional relevance on this instrument historically. A win rate significantly above 50% suggests the configuration carries predictive information worth paying attention to; near 50% suggests it has been essentially random.
For the statistical bands, start by enabling the symmetric ± 1σ and ± 2σ bands alongside the anchor line to get a baseline feel for the session's deviation range. Then enable the asymmetric bands on a few sessions where you noticed a strong directional bias to see how the upper and lower widths diverge. The MAD bands are most informative when compared directly against the ± 1σ bands — if MAD is substantially tighter it means the session has had outlier bars inflating the standard deviation that most of the session's activity did not participate in.
The VWAP of deviations line is a useful real-time bias read once you are familiar with it. In a session where the line has been consistently positive (above the anchor) since the open and has not reversed, the weight of volume is behind the bullish side of the anchor. A line that has drifted from positive to negative mid-session suggests a shift in volume-weighted participation, which often precedes or accompanies meaningful directional moves.
The timing data in the table is most useful when you have accumulated 50 or more sessions of history and are trading an instrument with a consistent intraday rhythm. Instruments with predictable open-range activity and a defined close pattern will show clear concentrations in the hourly breakdown. Instruments that are event-driven or highly macro-sensitive will tend to show flatter distributions.
The Max Days to Track setting has a meaningful effect on all statistics. A smaller value — say 20 or 30 — will make the statistics more responsive to recent conditions but noisier. A larger value — 200 or 500 — will produce more stable averages but may lag if the instrument's behaviour has changed regime. For most use cases 50 to 100 days strikes a reasonable balance.
On instruments where the pre-market session is not meaningful or does not exist, set the Session time window to a custom anchor of your choice — for example the overnight high or the globex open — and the Session VWAP will anchor from that point instead. The statistical framework operates identically regardless of what the session window represents.
─────────────────────────────────────────────
DISCLAIMER
─────────────────────────────────────────────
This indicator is provided for informational and educational purposes only. It does not constitute financial advice, investment advice, or a trading recommendation of any kind. All statistical outputs — win rates, retest averages, timing distributions — are derived from historical data and are not indicative of future results. The user assumes full responsibility for any trading decisions made using this tool. Always apply your own analysis and risk management.
This indicator plots two independently calculated Volume Weighted Average Price lines — one anchored to a user-defined pre-market or custom session, and one anchored to the Regular Trading Hours (RTH) open — and combines them into a statistical study that tracks the relationship between the two lines over time. Beyond the two VWAP lines themselves, the indicator calculates a set of statistical deviation bands derived from the midpoint between both VWAPs, maintains a live stats table that tracks retest and crossover behaviour with timing data, and records win/loss statistics based on the directional relationship between the two lines at the close of each RTH session.
The indicator is designed for equity futures traders and anyone who trades instruments with a defined RTH session, though it will function on any market where session times can be configured. It is most useful on intraday timeframes, particularly 1-minute through 15-minute charts, where the two VWAP lines are meaningfully separated and the statistical bands have enough bar data to fill in during the session.
─────────────────────────────────────────────
HOW THE TWO VWAPs WORK
─────────────────────────────────────────────
The Session VWAP anchors to the start of a configurable pre-market or custom session each day and recalculates bar by bar from that anchor using the standard cumulative price-times-volume divided by cumulative volume formula. Because it anchors before the RTH open on most configurations, it captures the overnight sentiment and carry-forward context that the RTH VWAP does not see. The line resets each day at the session start and, uniquely, reanchors dynamically if price makes a new session high — meaning the anchor always sits at the highest point reached during the session rather than being fixed at the first bar. This makes the Session VWAP a high-anchored VWAP that tracks where the average transaction has occurred relative to the session's developing high.
The RTH VWAP anchors to the first bar of the Regular Trading Hours session each day — defaulting to 09:30 EST — and calculates forward from that point. It is a straightforward daily VWAP in the conventional sense, widely used by institutional participants as an execution benchmark. It resets at the RTH open every day regardless of overnight price action.
Both VWAPs have independent price source inputs, so you can, for example, run the Session VWAP on HLC3 and the RTH VWAP on the close, or set both to the same source. Both default to HLC3. Previous session VWAP lines can be displayed on chart for historical context, with the number of retained sessions configurable up to 100.
─────────────────────────────────────────────
THE ANCHOR AND DEVIATION BANDS
─────────────────────────────────────────────
Once both VWAPs are active during the RTH session, the indicator calculates a midpoint anchor on each bar as the simple average of the two VWAP values at that moment. This anchor represents an equilibrium level between the two measures — a price around which both institutional benchmarks are balanced. The anchor can be plotted as a standalone line if desired.
All statistical bands are then derived as offsets from this anchor, calculated from the distribution of bar-by-bar deviations of the price source from the anchor during the current RTH session. Each bar inside the RTH session contributes a deviation value (price minus anchor) and an absolute deviation value to a running intraday dataset that the band calculations draw from. Every band type resets at the RTH open and builds from scratch each session, meaning the bands are always describing the current day's price behaviour relative to the anchor rather than any historical average.
Symmetric Standard Deviation Bands (± 1σ and ± 2σ)
These are calculated using the volume-weighted variance of all bar deviations from the anchor during the session. The formula weights each bar's squared deviation by its volume, so high-volume bars contribute proportionally more to the width of the bands than low-volume bars. The result is a proper volume-weighted standard deviation, not a simple statistical standard deviation. The ± 1σ bands mark the range within which approximately 68% of volume-weighted price activity has occurred relative to the anchor, and ± 2σ marks roughly 95%. On a well-behaved session these bands will tend to expand gradually and consistently as the day progresses. A sudden widening indicates a volatile push away from the anchor with significant volume behind it.
Asymmetric Standard Deviation Bands
Rather than computing a single standard deviation across all deviations, the asymmetric bands split the deviation dataset into two groups: bars where price was above the anchor and bars where price was below the anchor. A separate volume-weighted variance is computed for each group, yielding an upper sigma and a lower sigma. The upper band sits at anchor plus the upper sigma, and the lower band sits at anchor minus the lower sigma. When the upper band is wider than the lower band, the session's upside volatility has been greater than its downside volatility — the distribution is stretched to the upside. The reverse indicates downside skew. This is a more honest representation of intraday volatility than symmetric bands when the session has a directional bias, since symmetric bands will always produce identical upper and lower widths regardless of where price has actually been spending its time.
Median Absolute Deviation Bands (MAD)
The MAD bands are calculated from the median of all absolute deviation values collected during the session. Rather than squaring deviations as standard deviation does, MAD takes the median of their absolute values, making it substantially more resistant to outlier bars. A single spike bar with a large deviation will pull the standard deviation bands outward significantly, but will have very little impact on the MAD bands if the majority of bars have remained close to the anchor. In practice, if the MAD bands are noticeably narrower than the ± 1σ bands, it suggests the session has had one or more sharp but brief excursions from the anchor while most activity has been tightly contained. If the two are similar in width, price volatility has been more evenly distributed throughout the session.
Percentile Bands (10th, 25th, 75th, 90th)
These bands are calculated by sorting the full array of per-bar deviations accumulated during the session and finding the deviation at each percentile using linear interpolation between adjacent values. The result is added to the anchor to produce the plotted level. The 25th and 75th percentile bands define the interquartile range — the zone within which the middle 50% of bars have traded relative to the anchor. The 10th and 90th percentile bands mark the outer boundaries that only 10% of bars have exceeded on each side. Unlike standard deviation bands, percentile bands make no assumption about the shape of the deviation distribution. They are purely empirical — they describe exactly where price has been during the session without any statistical model underlying them. On a trending session the percentile bands will be visibly asymmetric, sitting closer together on one side of the anchor and more spread on the other, directly reflecting the directional distribution of bars.
VWAP of Deviations
This is a single line calculated as the volume-weighted mean of all bar deviations from the anchor during the session. It is plotted as an offset from the anchor — if the line is above the anchor, it means that volume has been transacting above the anchor on a net basis throughout the day. If it is below, the heavier volume has been printing below the anchor. At the very start of the RTH session when both VWAPs are close to each other the line will be near the anchor, and it will drift in the direction where the heavier volume has been occurring as the session progresses. It functions as a volume-weighted bias indicator — a reading consistently above the anchor suggests buyers have been more active on a volume basis, and vice versa.
─────────────────────────────────────────────
CONFIGURATION — SESSIONS SETTINGS
─────────────────────────────────────────────
Time Zone sets the timezone used to interpret the Session window. The tooltip reminds you that GMT and UTC are equivalent. Match this to the timezone shown in the bottom right of your TradingView chart. The default is GMT-4, which corresponds to US Eastern Daylight Time.
Session defines the start and end time of the window within which the Session VWAP is active and accumulating. The default is 0600-0900, representing the pre-market period from 6am to 9am Eastern. You can change this to any time window that suits your instrument and trading style. On instruments without an extended pre-market you might set this to your own session open or any other meaningful anchor time.
Highlight Session enables a background colour fill on bars that fall within the session window, making it easy to see which bars are contributing to the Session VWAP. The colour is configurable next to the toggle and defaults to a faint aqua.
─────────────────────────────────────────────
CONFIGURATION — ANCHOR SESSION VWAP SETTINGS
─────────────────────────────────────────────
VWAP Source sets the price input used for the Session VWAP calculation. The default is HLC3 (the average of high, low, and close), which is the conventional choice for VWAP calculations. Other available options include close, open, HL2, OHLC4, and HLCC4. Changing this will affect both the VWAP line itself and the deviation values used in the band calculations, since the bands use vsrc as their price input.
Session VWAP enables or disables the Session VWAP line on the chart. The colour and line width are set using the colour picker and width field next to the toggle.
Show Previous Session VWAPs enables the display of completed Session VWAP lines from prior days, drawn in the same colour as the live line. These give you a visual history of where previous sessions' VWAPs settled and how the current session compares.
Number of Previous Sessions controls how many prior session VWAP lines are retained on the chart. The range is 1 to 100, defaulting to 50. Higher values provide more historical context but may create visual clutter on longer lookback charts.
─────────────────────────────────────────────
CONFIGURATION — RTH VWAP SETTINGS
─────────────────────────────────────────────
Show RTH VWAP enables or disables the RTH VWAP line. The colour and width are set using the adjacent controls. The RTH VWAP defaults to purple at width 2, making it visually distinct from the thinner Session VWAP.
RTH Session Time (EST) sets the start and end of the RTH window using a session string in the format HHMM-HHMM, interpreted in the America/New_York timezone. The default is 0930-1600, representing the standard US equity market session. Change this for futures instruments that have different session boundaries, or for non-US markets where you want to define a custom RTH equivalent.
RTH VWAP Source sets the price input used specifically for the RTH VWAP calculation, independently of the Session VWAP source. It defaults to HLC3. Having separate source inputs means you can experiment with different price inputs on each line — for example running the RTH VWAP on the close while keeping the Session VWAP on HLC3 — or simply keep both on the same source for consistency.
─────────────────────────────────────────────
CONFIGURATION — STATS TABLE
─────────────────────────────────────────────
Show Stats Table enables or disables the on-chart statistics table.
Position sets where the table appears on the chart. Options cover all eight corners and edge-centre positions. The default is Top Right.
Text Size controls the font size used throughout the table. Options are Tiny, Small, and Normal. Small is the default and suits most screen configurations.
Max Days to Track sets the maximum number of completed RTH sessions the indicator retains in its historical arrays for statistical calculations. The range is 10 to 500, defaulting to 100. Increasing this provides more statistically stable averages but increases memory usage. All statistics in the table — win rate, retest averages, timing distributions, hourly breakdowns — are computed across however many sessions have been recorded up to this limit.
─────────────────────────────────────────────
CONFIGURATION — BAND LEVELS
─────────────────────────────────────────────
Each band type has a checkbox to enable it and one or more colour pickers to control how it appears. All bands are off by default. Each is described in detail in the statistical bands section above. The controls are:
Anchor (midpoint) — enables the midpoint line between the two VWAPs, with a single colour picker. Useful as a reference when evaluating the bands.
± 1σ (symmetric) — enables the symmetric ± 1 standard deviation bands, with a single shared colour applied to both the upper and lower line.
± 2σ (symmetric) — enables the symmetric ± 2 standard deviation bands, with a single shared colour.
Asymmetric σ (upper/lower) — enables the asymmetric bands with separate colour pickers for the upper and lower line, allowing you to visually distinguish upside from downside volatility.
MAD (± median abs dev) — enables the MAD bands with a single shared colour.
Percentile bands (10/25/75/90) — enables all four percentile bands with separate colour pickers for the inner pair (25th/75th) and the outer pair (10th/90th).
VWAP of deviations — enables the volume-weighted mean deviation line with a single colour picker.
─────────────────────────────────────────────
THE STATS TABLE — WHAT IT SHOWS AND HOW TO READ IT
─────────────────────────────────────────────
The table is divided into four sections. A yellow header row at the very top shows the total number of completed RTH sessions recorded and the maximum days setting, so you always know the sample size behind the statistics.
Sessions Coverage
The coverage row reads as "SESSIONS: X days | max tracked: Y". X is the number of completed RTH sessions the indicator has observed and recorded since being applied to the chart. Y is the Max Days to Track setting. Once X equals Y the oldest sessions begin dropping off as new ones are added, keeping a rolling window. On a 1-minute chart with 100 max days, the indicator will typically reach the maximum within the first few weeks of chart data.
Win / Loss
This section tracks whether the relative position of the two VWAPs at the end of the RTH session correctly predicted the directional close for that day.
The TODAY row shows the current live state: whether the RTH VWAP is currently above or below the Session VWAP (RTH ABOVE or RTH BELOW), and whether price is currently above or below the RTH open (BULL or BEAR). If the RTH session has not yet started, it shows AWAITING.
WIN RATE shows the percentage of completed sessions in which the end-of-day RTH VWAP position correctly predicted the directional close. A session is counted as a win when the RTH VWAP finished above the Session VWAP and price closed above the RTH open (a bullish alignment), or when the RTH VWAP finished below the Session VWAP and price closed below the RTH open (a bearish alignment). The detail column shows the raw count as wins over total sessions.
BULL/BEAR shows the breakdown of winning sessions by direction — how many of the wins were in the bullish alignment versus the bearish alignment. This helps identify whether the signal has directional asymmetry on your instrument.
STREAK shows whether the current streak is a run of wins or losses and how many consecutive sessions it has lasted.
Retests & Crossovers
This section measures two types of intraday behaviour: VWAP retests and VWAP crossovers.
A retest is recorded when a bar's wick crosses through one of the VWAPs but the bar's close remains on the same side it was on before the wick. In other words, price touches or briefly pierces the VWAP level but the candle does not close through it, indicating the level held. RTH RETEST counts retests of the RTH VWAP and SESS RETEST counts retests of the Session VWAP. The mean and median columns show the average and median number of these events per day across the recorded session history. A mean of 3.2 for RTH retests, for example, means the RTH VWAP is typically touched and rejected roughly three times per session.
A crossover is recorded when the RTH VWAP crosses above or below the Session VWAP on a confirmed bar. This is a stronger event than a retest because it means the two benchmarks have swapped relative positions. CROSSOVERS shows the average and median number of such crosses per day. On low-volatility days in a clearly directional instrument the crossover count may be zero or one. On ranging or volatile days it may be several.
Event Timing
This section answers the question of when during the RTH session these events tend to happen. For each of the three event types — RTH retest, Session retest, and crossover — it shows the average time, the median time, and the peak hour, all in EST.
The average time is the mean of the fractional hour at which each event has occurred across the full history, converted to a HH:MM display. The median time is the 50th percentile of that same distribution. The peak hour is whichever one-hour bucket between 09:00 and 15:00 has accumulated the most events in total across the session history.
If the median RTH retest time is 10:08 and the peak hour is 10h, that tells you retests of the RTH VWAP have historically been most concentrated in the first hour after the open. If the average and median are separated — say average is 11:30 but median is 10:45 — it suggests there is a tail of late-session events pulling the mean later, but most activity happens earlier.
Hourly Event Count
This section gives you the raw breakdown of event counts by hour, running from the 09:00 hour through to the 15:00 hour. Each row represents one hour and shows the total number of RTH retests, Session retests, and crossovers that have occurred during that hour across all recorded sessions. This is the full distribution from which the peak hour in the timing section is derived, and it lets you see the shape of that distribution rather than just the peak. An instrument where the hourly counts are spread fairly evenly across all hours behaves very differently to one where most events are concentrated in the 09:00 and 15:00 hours, and that pattern is immediately visible here.
─────────────────────────────────────────────
TIPS FOR EFFECTIVE USE
─────────────────────────────────────────────
Start with the two VWAP lines alone and observe how often the RTH VWAP and Session VWAP converge, diverge, and cross during your instrument's typical session. The relative position of the two lines at the open versus at midday and close is the core input to the win/loss tracking, so developing an intuition for how they interact on your specific instrument before enabling the bands is worthwhile.
The win rate statistic is a measure of historical alignment between the two VWAPs and the daily directional close — it is not a prediction of tomorrow's outcome. Its value is in telling you whether the two-VWAP relationship has had directional relevance on this instrument historically. A win rate significantly above 50% suggests the configuration carries predictive information worth paying attention to; near 50% suggests it has been essentially random.
For the statistical bands, start by enabling the symmetric ± 1σ and ± 2σ bands alongside the anchor line to get a baseline feel for the session's deviation range. Then enable the asymmetric bands on a few sessions where you noticed a strong directional bias to see how the upper and lower widths diverge. The MAD bands are most informative when compared directly against the ± 1σ bands — if MAD is substantially tighter it means the session has had outlier bars inflating the standard deviation that most of the session's activity did not participate in.
The VWAP of deviations line is a useful real-time bias read once you are familiar with it. In a session where the line has been consistently positive (above the anchor) since the open and has not reversed, the weight of volume is behind the bullish side of the anchor. A line that has drifted from positive to negative mid-session suggests a shift in volume-weighted participation, which often precedes or accompanies meaningful directional moves.
The timing data in the table is most useful when you have accumulated 50 or more sessions of history and are trading an instrument with a consistent intraday rhythm. Instruments with predictable open-range activity and a defined close pattern will show clear concentrations in the hourly breakdown. Instruments that are event-driven or highly macro-sensitive will tend to show flatter distributions.
The Max Days to Track setting has a meaningful effect on all statistics. A smaller value — say 20 or 30 — will make the statistics more responsive to recent conditions but noisier. A larger value — 200 or 500 — will produce more stable averages but may lag if the instrument's behaviour has changed regime. For most use cases 50 to 100 days strikes a reasonable balance.
On instruments where the pre-market session is not meaningful or does not exist, set the Session time window to a custom anchor of your choice — for example the overnight high or the globex open — and the Session VWAP will anchor from that point instead. The statistical framework operates identically regardless of what the session window represents.
─────────────────────────────────────────────
DISCLAIMER
─────────────────────────────────────────────
This indicator is provided for informational and educational purposes only. It does not constitute financial advice, investment advice, or a trading recommendation of any kind. All statistical outputs — win rates, retest averages, timing distributions — are derived from historical data and are not indicative of future results. The user assumes full responsibility for any trading decisions made using this tool. Always apply your own analysis and risk management.
オープンソーススクリプト
TradingViewの精神に則り、このスクリプトの作者はコードをオープンソースとして公開してくれました。トレーダーが内容を確認・検証できるようにという配慮です。作者に拍手を送りましょう!無料で利用できますが、コードの再公開はハウスルールに従う必要があります。

免責事項
これらの情報および投稿は、TradingViewが提供または承認する金融、投資、取引、またはその他の種類の助言もしくは推奨であることを意図したものではなく、またこれらに該当するものでもありません。詳細は利用規約をご覧ください。
オープンソーススクリプト
TradingViewの精神に則り、このスクリプトの作者はコードをオープンソースとして公開してくれました。トレーダーが内容を確認・検証できるようにという配慮です。作者に拍手を送りましょう!無料で利用できますが、コードの再公開はハウスルールに従う必要があります。
免責事項
これらの情報および投稿は、TradingViewが提供または承認する金融、投資、取引、またはその他の種類の助言もしくは推奨であることを意図したものではなく、またこれらに該当するものでもありません。詳細は利用規約をご覧ください。