アップデート済
Bitcoin 4-Year Cycle Lookback Marker
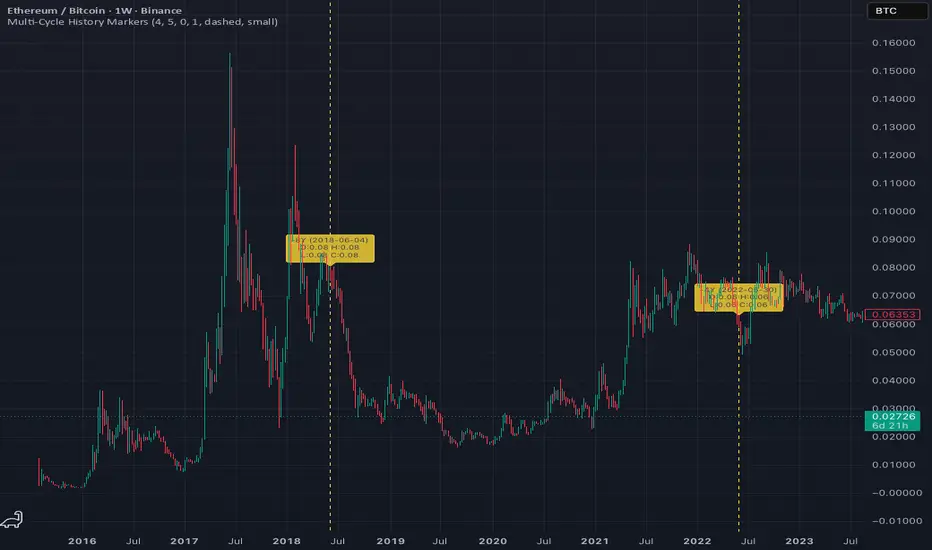
Automatically plots a vertical marker at the bar occurring exactly N years ago (default: 4 years), allowing traders and investors to quickly locate and study historical market conditions, cycle lows, cycle highs, and key events from prior Bitcoin market cycles.
Full Description:
The Bitcoin 4-Year Cycle Lookback Marker is designed for cycle analysis and historical market research.
Instead of manually scrolling through years of price action, this indicator automatically places a vertical marker on the chart at a configurable lookback period, making it easy to compare current market conditions with prior cycle stages.
Features:
• Adjustable lookback period (default 4 years)
• Fine-tuning with day offsets
• Customizable marker color, width, and style
• Optional historical price and date labels
• Works across all chart timeframes
• Designed for Bitcoin cycle and halving-cycle analysis
Common Uses:
• Identify where Bitcoin traded four years ago today
• Compare current market structure to previous cycles
• Locate historical highs, lows, consolidations, and breakouts
• Study market behavior before and after halving events
• Build data-driven cycle frameworks
This indicator is intended as a research and educational tool and does not provide trading signals or financial advice.
Full Description:
The Bitcoin 4-Year Cycle Lookback Marker is designed for cycle analysis and historical market research.
Instead of manually scrolling through years of price action, this indicator automatically places a vertical marker on the chart at a configurable lookback period, making it easy to compare current market conditions with prior cycle stages.
Features:
• Adjustable lookback period (default 4 years)
• Fine-tuning with day offsets
• Customizable marker color, width, and style
• Optional historical price and date labels
• Works across all chart timeframes
• Designed for Bitcoin cycle and halving-cycle analysis
Common Uses:
• Identify where Bitcoin traded four years ago today
• Compare current market structure to previous cycles
• Locate historical highs, lows, consolidations, and breakouts
• Study market behavior before and after halving events
• Build data-driven cycle frameworks
This indicator is intended as a research and educational tool and does not provide trading signals or financial advice.
リリースノート
Automatically plots a vertical marker at the bar occurring exactly N years ago (default: 4 years), allowing traders and investors to quickly locate and study historical market conditions, cycle lows, cycle highs, and key events from prior Bitcoin market cycles.Full Description:
The Bitcoin 4-Year Cycle Lookback Marker is designed for cycle analysis and historical market research.
Instead of manually scrolling through years of price action, this indicator automatically places a vertical marker on the chart at a configurable lookback period, making it easy to compare current market conditions with prior cycle stages.
Features:
• Adjustable lookback period (default 4 years)
• Fine-tuning with day offsets
• Customizable marker color, width, and style
• Optional historical price and date labels
• Works across all chart timeframes
• Designed for Bitcoin cycle and halving-cycle analysis
Common Uses:
• Identify where Bitcoin traded four years ago today
• Compare current market structure to previous cycles
• Locate historical highs, lows, consolidations, and breakouts
• Study market behavior before and after halving events
• Build data-driven cycle frameworks
This indicator is intended as a research and educational tool and does not provide trading signals or financial advice.

免責事項
これらの情報および投稿は、TradingViewが提供または承認する金融、投資、取引、またはその他の種類の助言もしくは推奨であることを意図したものではなく、またこれらに該当するものでもありません。詳細は利用規約をご覧ください。
免責事項
これらの情報および投稿は、TradingViewが提供または承認する金融、投資、取引、またはその他の種類の助言もしくは推奨であることを意図したものではなく、またこれらに該当するものでもありません。詳細は利用規約をご覧ください。