Vishal Trades Support & Resistance
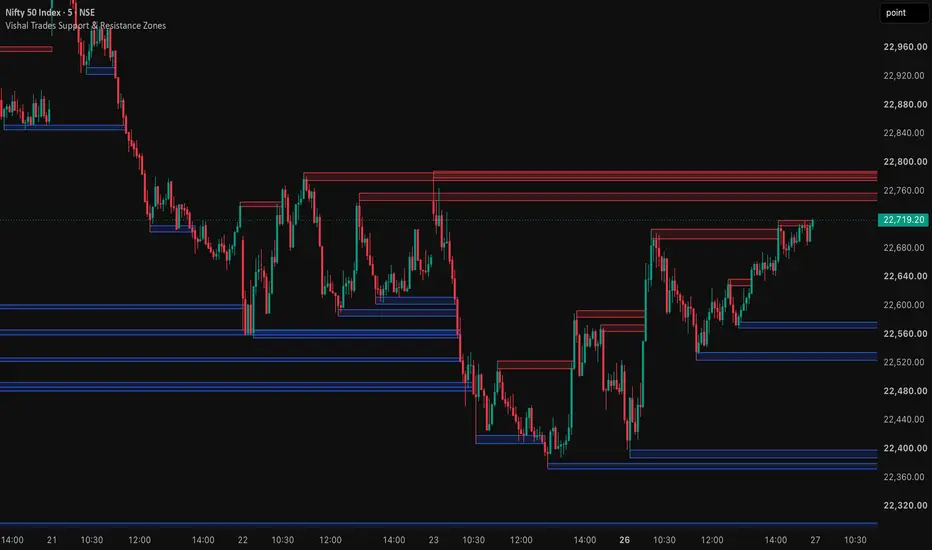
VISHAL TRADES SUPPORT & RESISTANCE ZONES
Vishal Trades Support & Resistance Zones automatically identifies potential support and resistance areas using confirmed swing highs and lows. It helps traders spot important price levels, anticipate potential market reactions, and plan entries and exits more effectively. Untested zones extend to the right until price breaks them.
KEY FEATURES
🔴 Red Zones: Potential resistance areas.
🔵 Blue Zones: Potential support areas.
➡️ Extended Zones: Untested zones continue extending to the right.
📊 Automatic Detection: Identifies zones using price action and swing points.
🎯 Breakout Tracking: Zones stop extending when price closes beyond their boundaries.
⏱️ Recommended Timeframes: Works best on 5-minute and 15-minute charts.
DISCLAIMER
This indicator is an analytical tool, not a guarantee of future price movements. Always use proper risk management.
Vishal Trades Support & Resistance Zones automatically identifies potential support and resistance areas using confirmed swing highs and lows. It helps traders spot important price levels, anticipate potential market reactions, and plan entries and exits more effectively. Untested zones extend to the right until price breaks them.
KEY FEATURES
🔴 Red Zones: Potential resistance areas.
🔵 Blue Zones: Potential support areas.
➡️ Extended Zones: Untested zones continue extending to the right.
📊 Automatic Detection: Identifies zones using price action and swing points.
🎯 Breakout Tracking: Zones stop extending when price closes beyond their boundaries.
⏱️ Recommended Timeframes: Works best on 5-minute and 15-minute charts.
DISCLAIMER
This indicator is an analytical tool, not a guarantee of future price movements. Always use proper risk management.

We Teach, You Trade.
youtube.com/@vishaltrades
youtube.com/@vishaltrades
免責事項
これらの情報および投稿は、TradingViewが提供または承認する金融、投資、取引、またはその他の種類の助言もしくは推奨であることを意図したものではなく、またこれらに該当するものでもありません。詳細は利用規約をご覧ください。
We Teach, You Trade.
youtube.com/@vishaltrades
youtube.com/@vishaltrades
免責事項
これらの情報および投稿は、TradingViewが提供または承認する金融、投資、取引、またはその他の種類の助言もしくは推奨であることを意図したものではなく、またこれらに該当するものでもありません。詳細は利用規約をご覧ください。